
Introduction
In the ever-evolving world of software development, the rise of serverless architecture has revolutionized the way we design and deploy our applications. Serverless computing, where the cloud provider manages the underlying infrastructure, allows developers to focus solely on writing and deploying their code, without worrying about server provisioning, scaling, or maintenance.
One crucial aspect of designing and understanding serverless architectures is the use of sequence diagrams. Sequence diagrams provide a visual representation of the interactions and flow of messages between different components or entities within a system. They are an essential tool for architects, developers, and stakeholders to comprehend the complex interactions and dependencies in a serverless environment.
In this blog post, we will delve into the significance of sequence diagrams in serverless architectures, explore practical examples, and demonstrate the use of ZenUML, a powerful diagramming tool, to create these diagrams.
The Importance of Sequence Diagrams in Serverless Architectures
Serverless architectures, by their very nature, introduce a level of complexity due to the distributed nature of the system and the interactions between various services, functions, and event triggers. Sequence diagrams play a critical role in understanding and communicating this complexity effectively.
-
Visualizing Workflow: Sequence diagrams provide a clear and concise visual representation of the interactions between different components in a serverless system. This helps stakeholders, developers, and architects understand the flow of data and events, making it easier to identify potential bottlenecks, dependencies, and areas for optimization.
-
Documenting Interactions: Serverless architectures often involve multiple services, functions, and event triggers working together. Sequence diagrams serve as a valuable documentation tool, capturing the sequence of messages and interactions between these components, making it easier to maintain and evolve the system over time.
-
Debugging and Troubleshooting: When issues arise in a serverless environment, sequence diagrams can provide a clear roadmap for identifying the source of the problem. By visualizing the flow of events, developers can quickly pinpoint the point of failure and address the underlying issues.
-
Facilitating Communication: Sequence diagrams serve as a common language for collaboration among different teams, including developers, architects, and stakeholders. They enable effective communication and shared understanding of the system's dynamics, fostering better decision-making and alignment.
-
Designing Scalable and Resilient Architectures: By modeling the interactions and dependencies in a serverless system, sequence diagrams can help architects design more scalable and resilient architectures. They can identify potential bottlenecks, single points of failure, and areas where additional fault tolerance or load balancing may be required.
Practical Examples: Serverless Architectures with Sequence Diagrams
Now, let's explore some practical examples of how sequence diagrams can be used to model different serverless architectures.
Example 1: Serverless Web Application
Imagine a serverless web application that allows users to upload images and store them in an Amazon S3 bucket. When an image is uploaded, a Lambda function is triggered to perform image processing and store the processed image in another S3 bucket.
Here's the sequence diagram for this scenario:
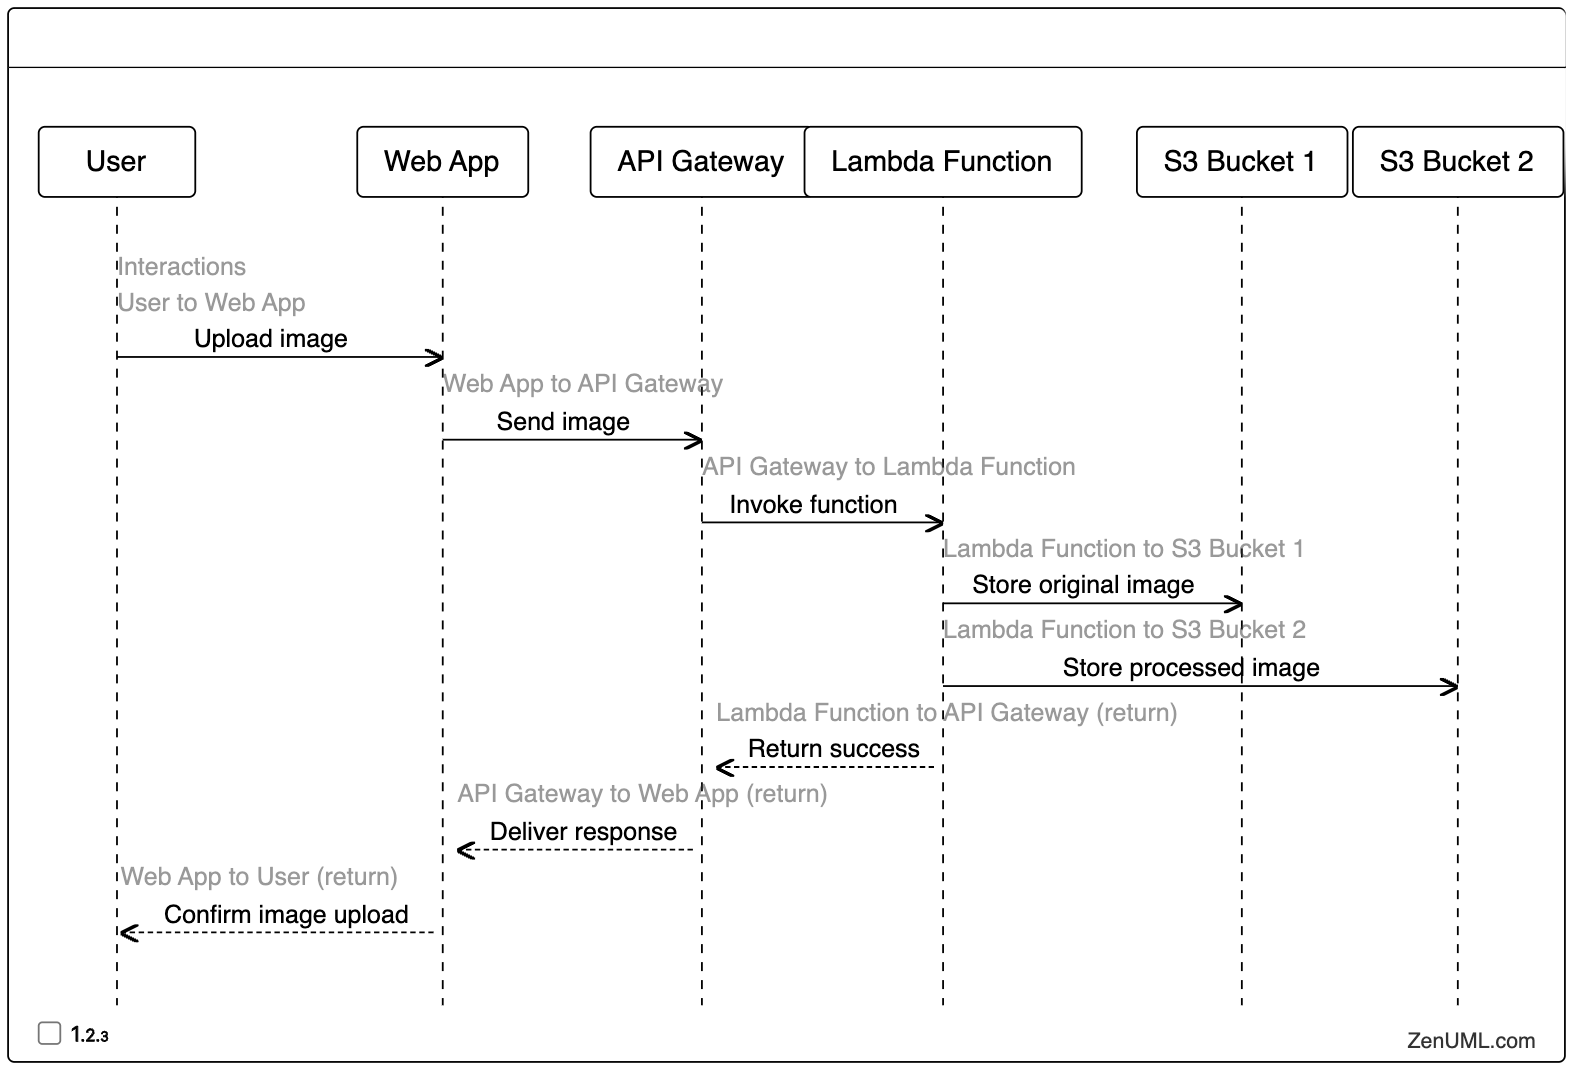
In this example, the sequence diagram shows the flow of interactions between the user, the web application, the API Gateway, the Lambda function, and the two S3 buckets. It helps visualize the event-driven nature of the serverless architecture and the asynchronous communication between the different components.
Example 2: Serverless Event-Driven Data Processing
Consider a scenario where a company processes customer orders in a serverless environment. When a new order is placed, an event is triggered that invokes a Lambda function to process the order and update the order status in a DynamoDB table. Additionally, another Lambda function is triggered to send a notification to the customer.
Here's the sequence diagram for this use case:
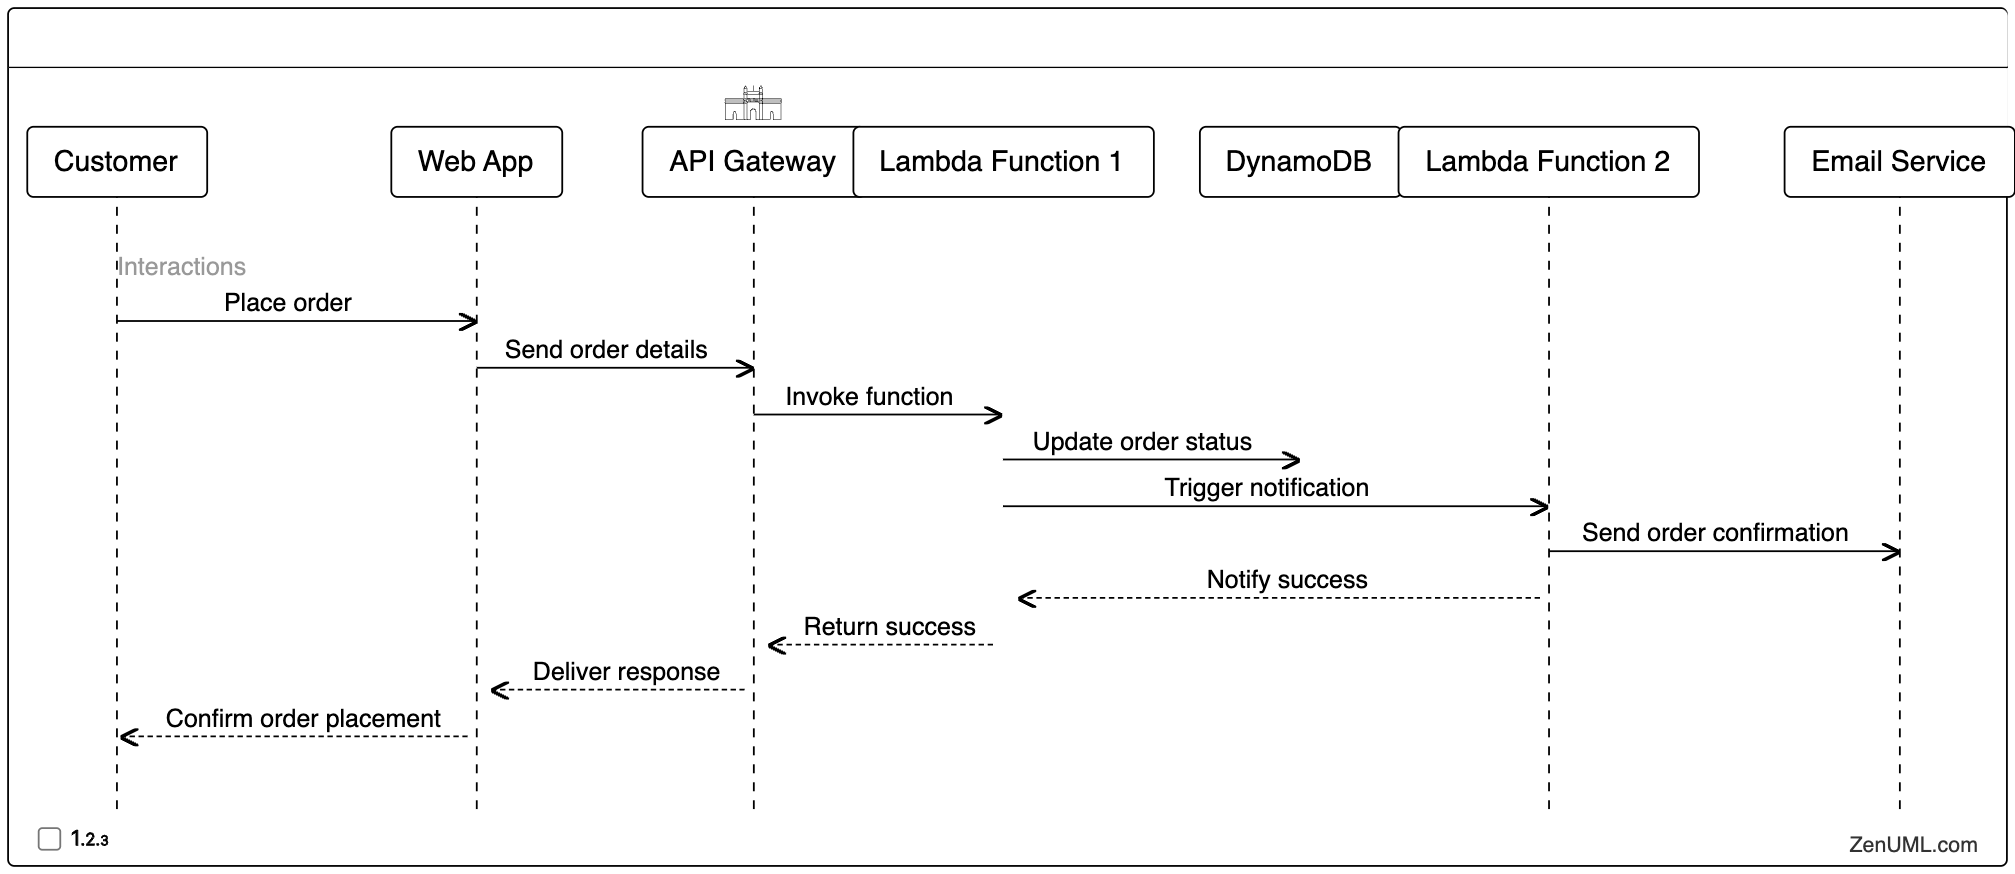
This sequence diagram illustrates the flow of events, starting from the customer placing an order through the web application, the order being processed by the Lambda function, the order status being updated in DynamoDB, and the notification being sent to the customer through the email service.
Example 3: Serverless IoT Data Processing
In an IoT (Internet of Things) scenario, sensor data is collected and processed in a serverless environment. Whenever a sensor sends data, an event is triggered that invokes a Lambda function to process the data and store it in an Amazon Kinesis Data Stream. Another Lambda function is then triggered to perform real-time analytics on the data and publish the results to an Amazon SNS topic.
Here's the sequence diagram for this use case:
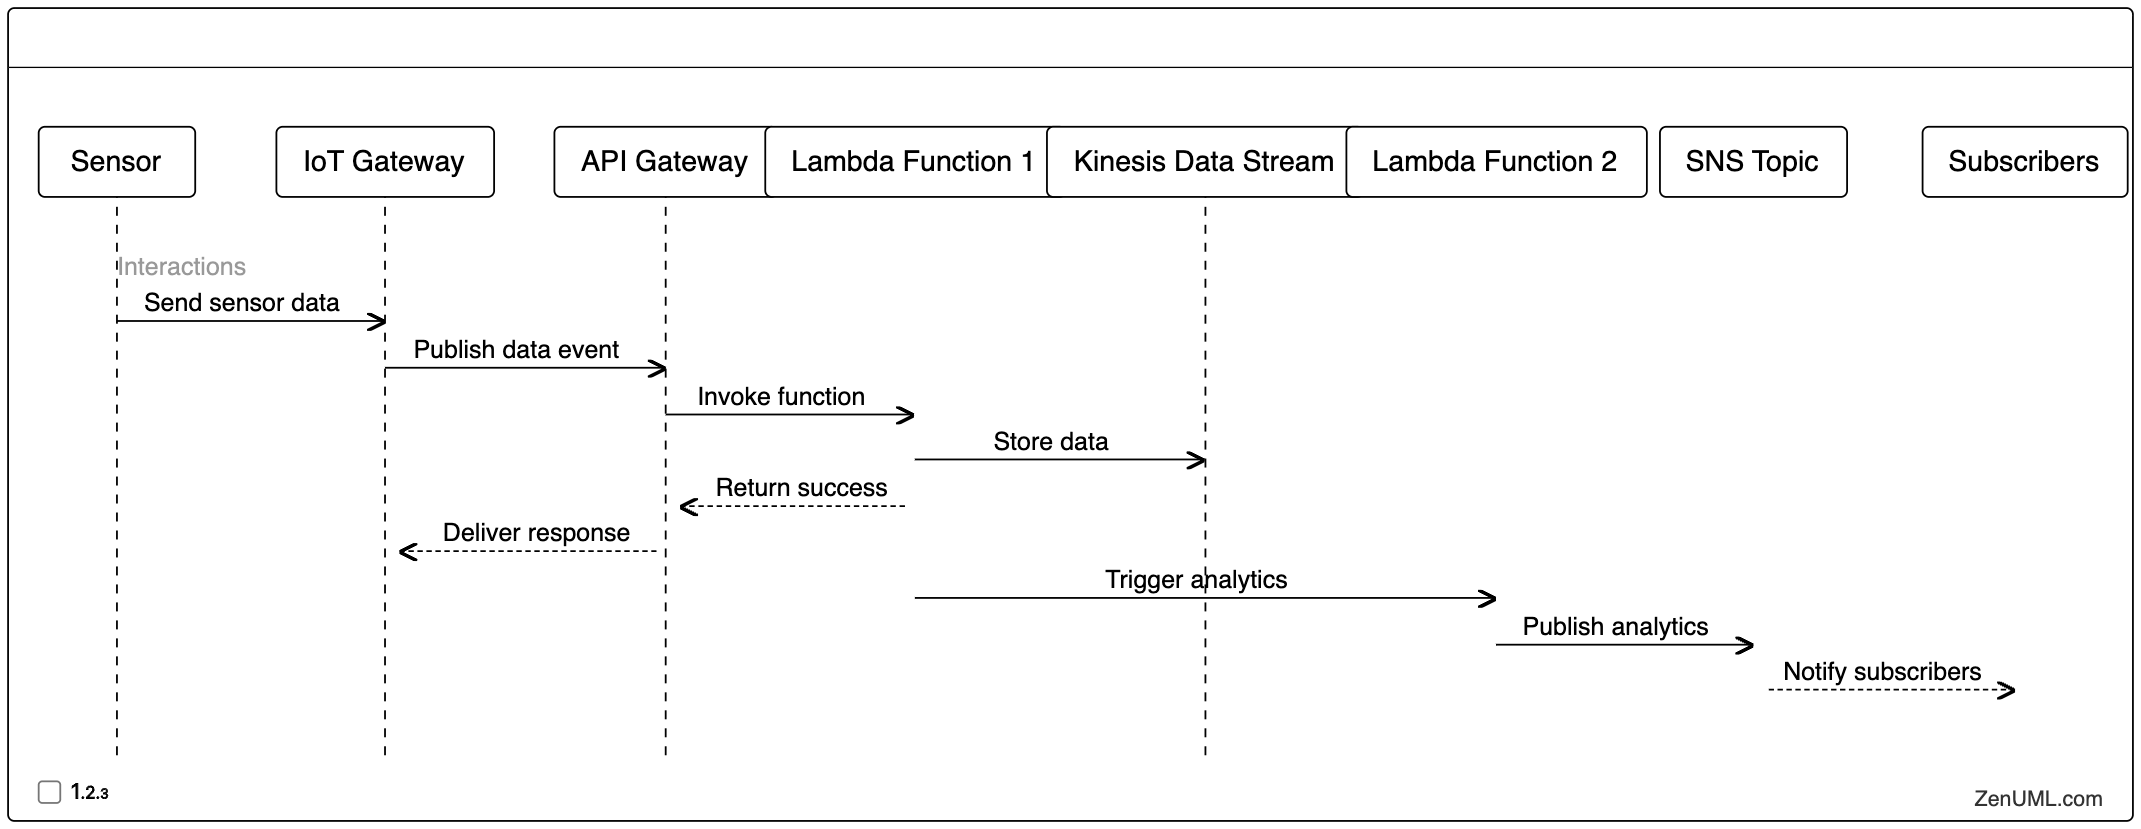
In this example, the sequence diagram shows the flow of data from the sensor to the IoT gateway, the processing of the data by the first Lambda function, the storage of the data in the Kinesis Data Stream, the triggering of the second Lambda function for real-time analytics, and the publication of the analytics results to the SNS topic.
Conclusion
Sequence diagrams have become an essential tool in the world of serverless architectures, where the complexity of interactions and dependencies between various components requires clear visualization and understanding.
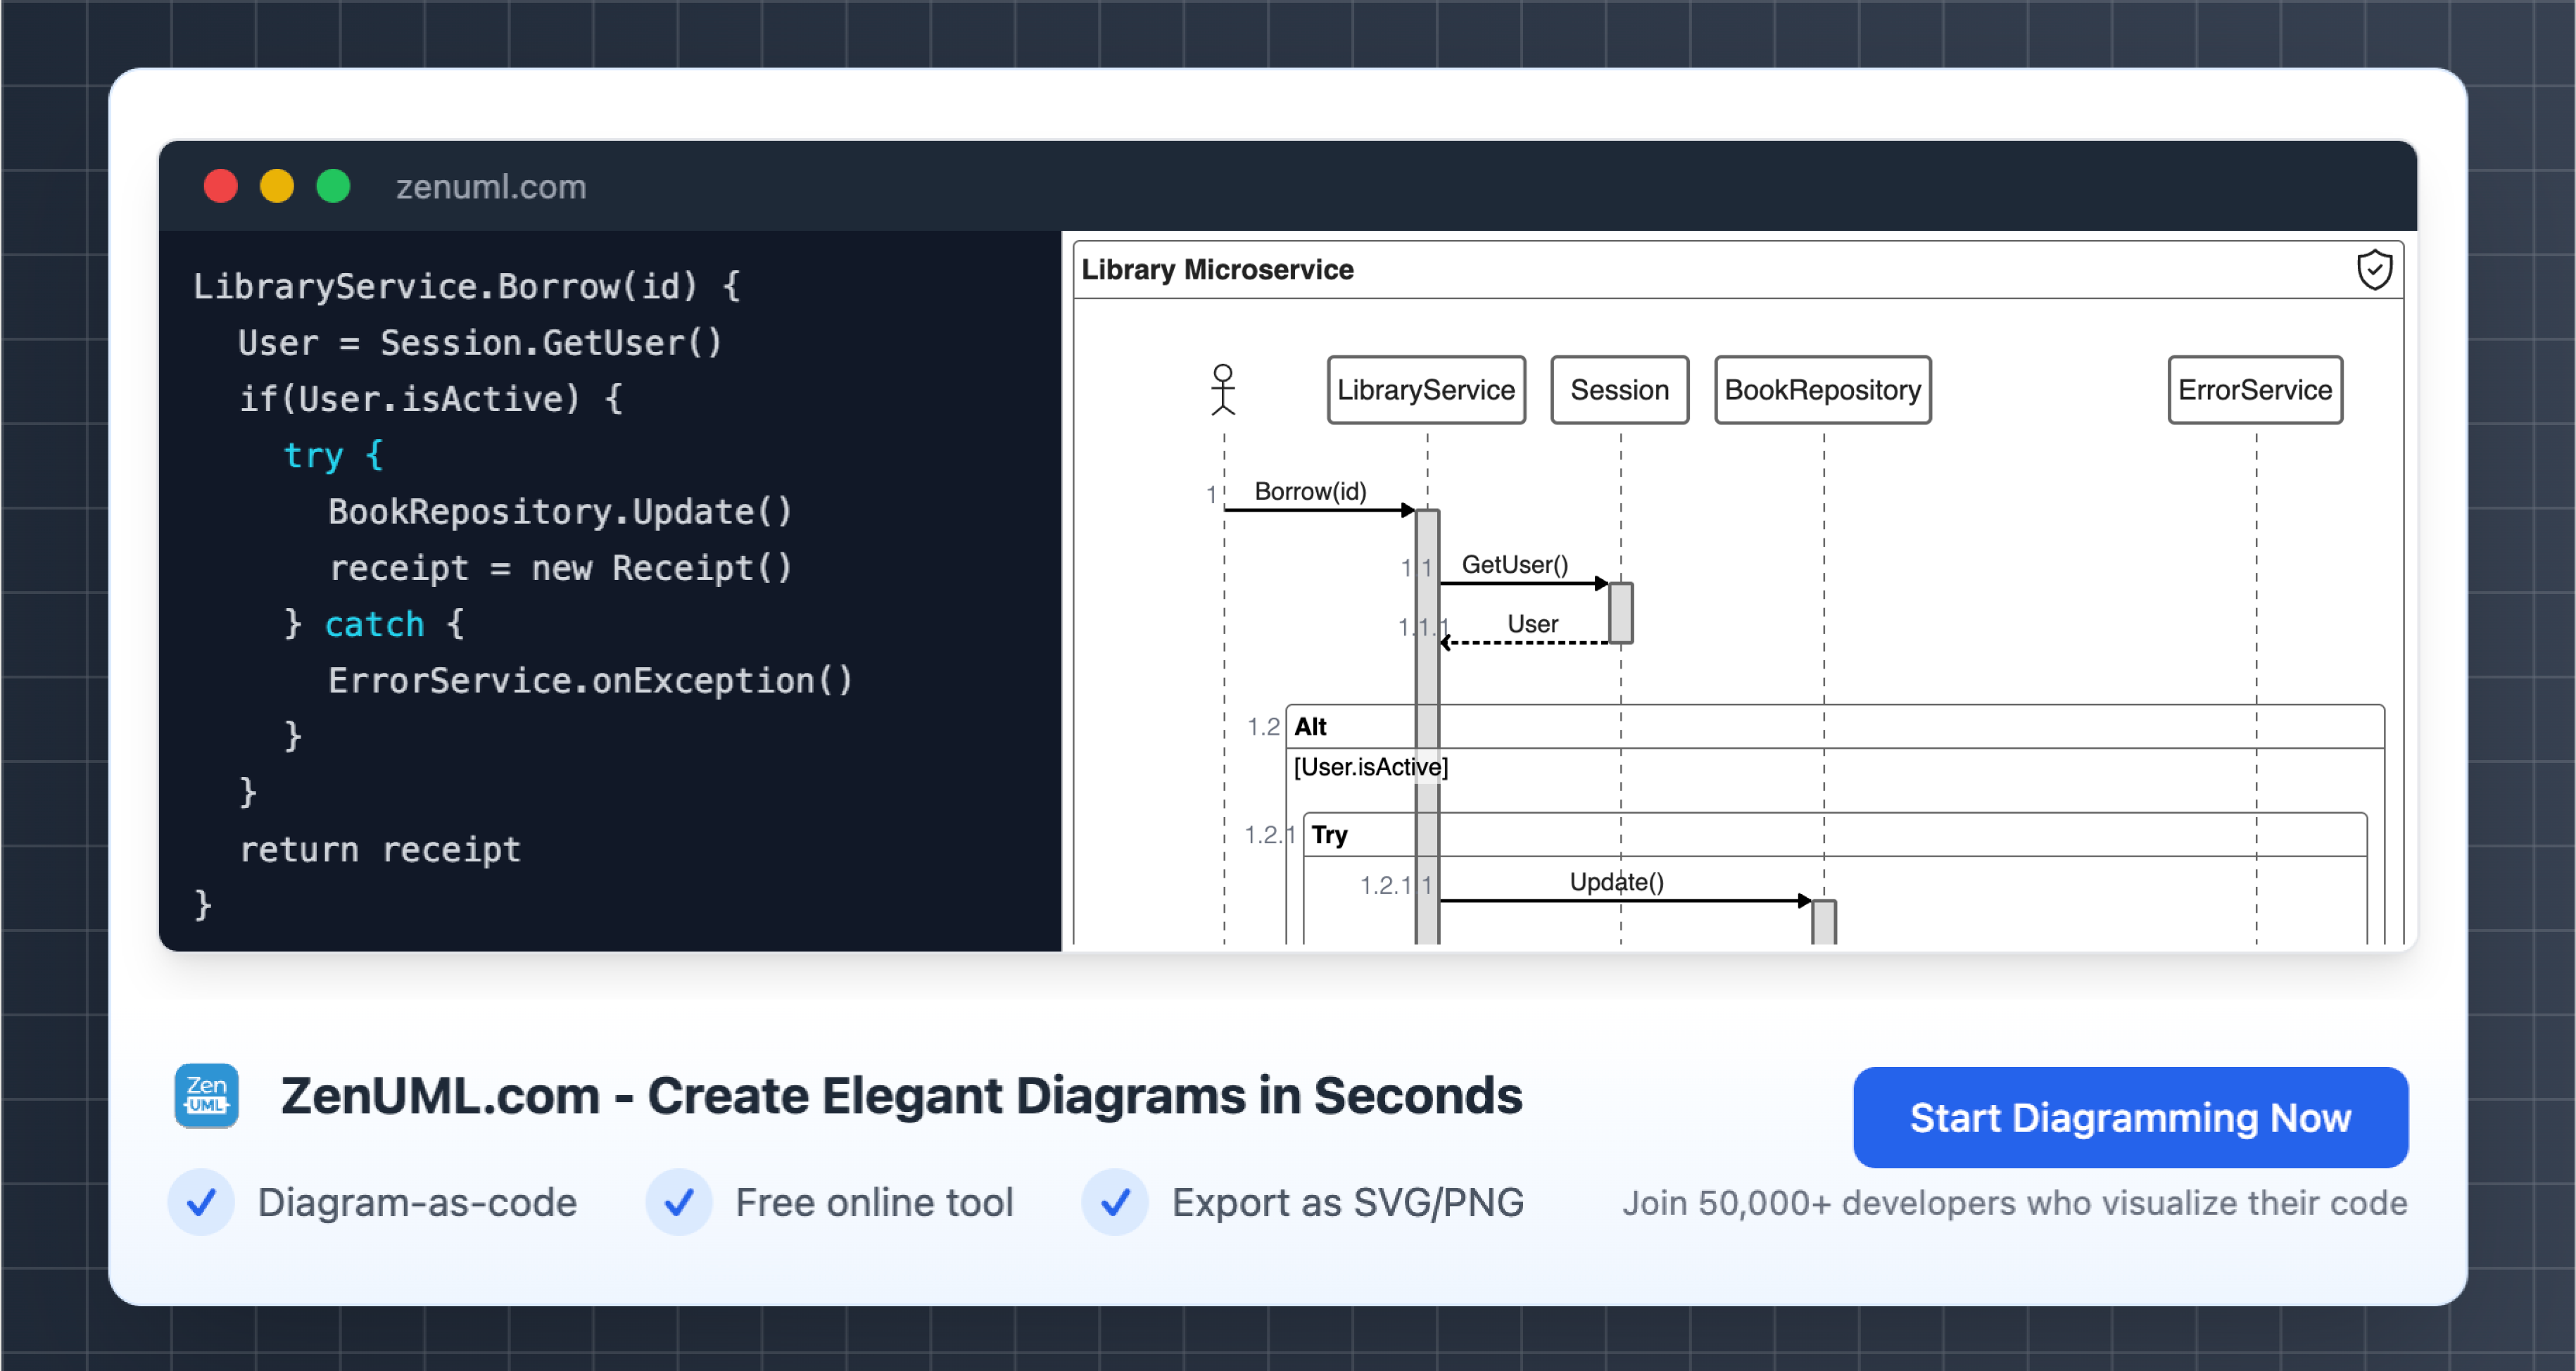
By using ZenUML, a powerful diagramming tool, you can easily create and customize sequence diagrams to model your serverless architectures.
Try ZenUML now!
Zenuml detailed feature roadmap available here.