Introduction
Artificial Intelligence (AI) and Machine Learning (ML) have become increasingly prevalent in modern technology, transforming the way we interact with and leverage data. As these technologies continue to evolve, the complexity of AI and ML projects has grown exponentially. Amidst this complexity, effectively communicating the various components and their interactions is crucial for successful project implementation.
One powerful tool that can help bridge this gap is the use of sequence diagrams. Sequence diagrams are a type of Unified Modeling Language (UML) diagram that visually depicts the flow of messages and interactions between different entities within a system. In the context of AI and ML projects, sequence diagrams can provide a clear and comprehensive understanding of the steps involved in data preprocessing, model training, and the inference phase.
The Importance of Sequence Diagrams in AI and ML Projects
Visualizing Data Preprocessing
Data preprocessing is a critical step in any AI or ML project, as it ensures the quality and integrity of the data used for model training. Sequence diagrams can help illustrate the various steps involved in this process, such as data collection, cleaning, transformation, and feature engineering. By clearly outlining these steps, sequence diagrams can help team members, stakeholders, and even clients understand the underlying data flow and identify potential bottlenecks or areas for optimization.
Documenting Model Training
The model training phase is the heart of any AI or ML project, where the algorithm learns from the preprocessed data to make predictions or decisions. Sequence diagrams can be used to document the interactions between different components, such as the data source, the model training engine, and any external services or APIs involved. This can help ensure that the training process is well-understood and can be easily replicated or scaled in the future.
Streamlining the Inference Phase
Once the model is trained, the inference phase is where the model is deployed and used to make predictions or decisions on new data. Sequence diagrams can help illustrate the flow of data through the various components involved in this phase, such as the model serving infrastructure, the input data sources, and the output channels. This can help identify potential points of failure, optimize performance, and ensure that the inference process is well-integrated with the rest of the system.
Enhancing Communication and Collaboration
Effective communication is crucial in the successful delivery of AI and ML projects. Sequence diagrams can serve as a common language for team members with diverse backgrounds, from data scientists to software engineers to project managers. By providing a visual representation of the system, sequence diagrams can help foster better understanding, facilitate discussions, and improve collaboration among team members.
Key Components of Sequence Diagrams for AI and ML Projects
Data Preprocessing
The data preprocessing sequence diagram should illustrate the steps involved in collecting, cleaning, transforming, and engineering features from the raw data. This may include activities such as data extraction from various sources, data cleaning and normalization, feature selection, and feature engineering.
Model Training
The model training sequence diagram should depict the interactions between the data source, the model training engine, and any external services or APIs involved in the training process. This may include activities such as data splitting, model selection, hyperparameter tuning, and model evaluation.
Inference Phase
The inference phase sequence diagram should showcase the flow of data from the input sources, through the model serving infrastructure, and to the output channels. This may include activities such as data ingestion, model serving, and result delivery.
System Integration
In many AI and ML projects, the AI components interact with other system parts, such as user interfaces, databases, or external services. Sequence diagrams can help illustrate these interactions, ensuring that the data flows are correctly understood and implemented.
Practical Example: Sequence Diagrams in an AI-powered Customer Service Chatbot
Let's consider a practical example of using sequence diagrams in an AI-powered customer service chatbot project.
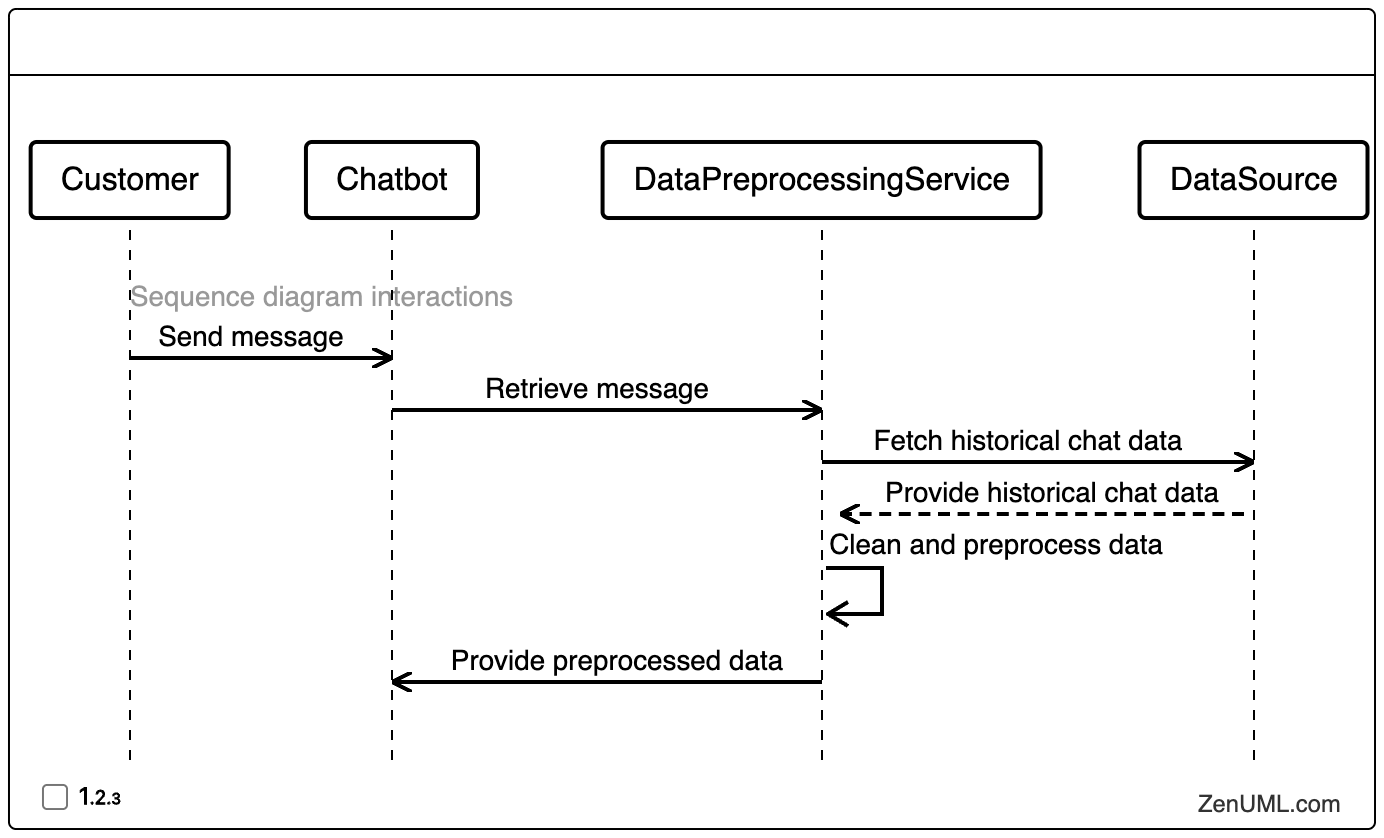
Data Preprocessing Sequence Diagram

This sequence diagram illustrates the steps involved in data preprocessing for the chatbot system. It shows how the chatbot interacts with the data preprocessing service to retrieve and preprocess the historical chat data, which is then used to train the AI model.
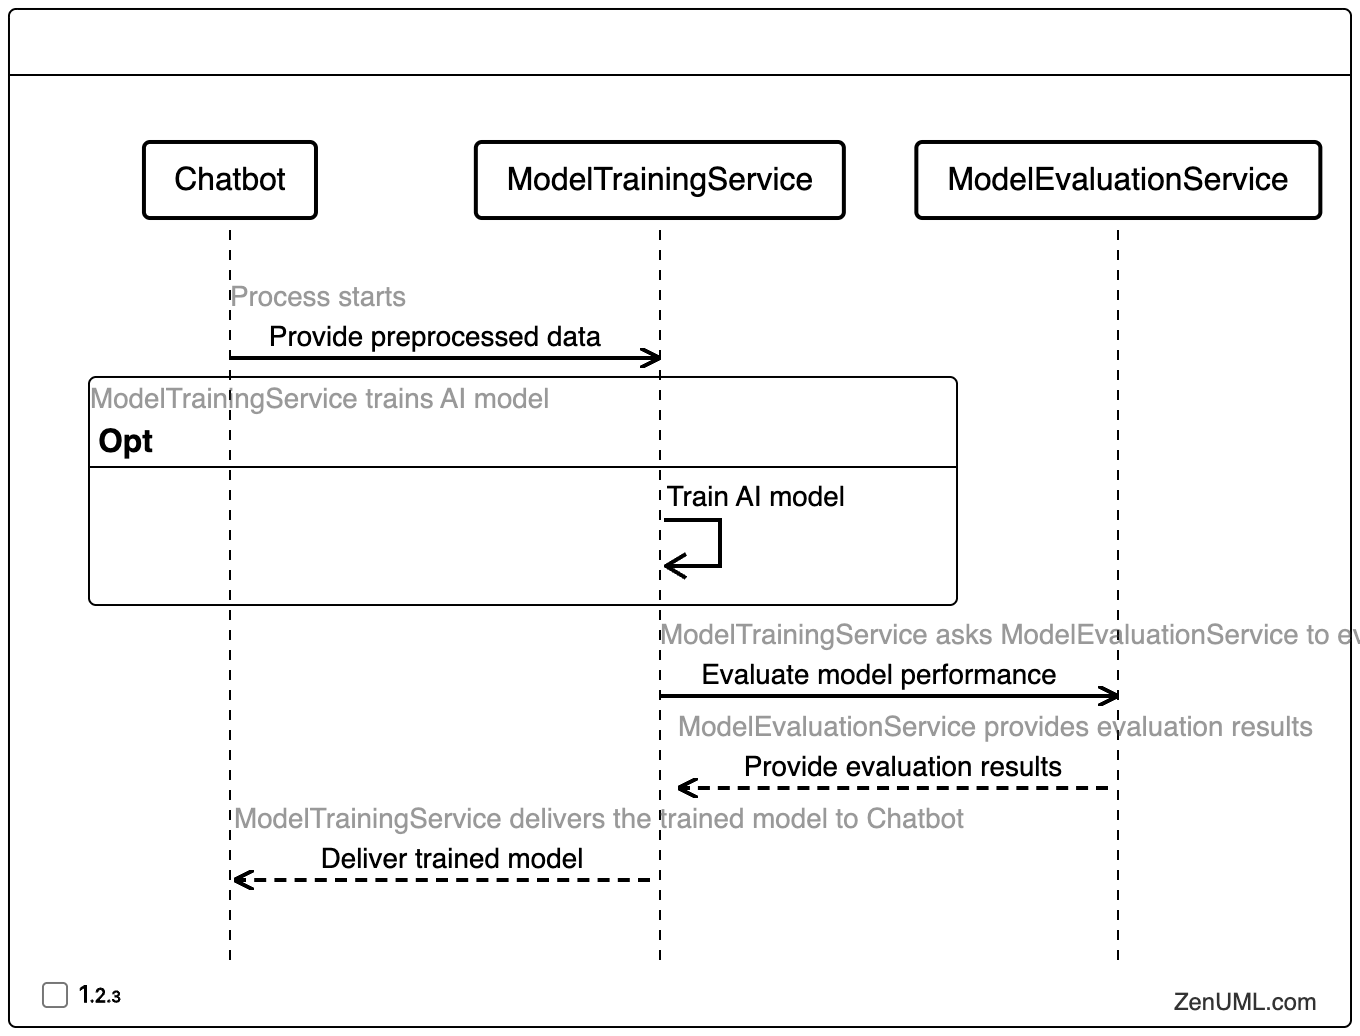
Model Training Sequence Diagram

This sequence diagram depicts the model training process. It shows how the chatbot interacts with the model training service to provide the preprocessed data, and how the model training service collaborates with the model evaluation service to train and evaluate the AI model.
Conclusion
In the dynamic and complex world of AI and ML projects, sequence diagrams have become an invaluable tool for enhancing communication, collaboration, and understanding. By clearly visualizing the data preprocessing, model training, and inference phases, sequence diagrams can help ensure that all stakeholders, from data scientists to software engineers, are on the same page.
As AI and ML continue to shape the technological landscape, the importance of effective project management and communication will only grow. By leveraging the power of sequence diagrams, AI and ML teams can build more robust, scalable, and adaptable systems that drive innovation and deliver real-world impact. So, embrace the power of sequence diagrams and unlock the full potential of your AI and ML projects!
We'd love to hear your thoughts and experiences in the comments below. How have you used sequence diagrams to enhance your AI and ML projects? What other techniques or tools have you found helpful in managing the complexity of these endeavors?
Try ZenUML now!
Zenuml detailed feature roadmap available here.

