Original Article by Kevin Hakanson
Architecture diagrams visually communicate and document the high-level design of a solution. As the level of detail increases, so does the diagram’s size, density, and layout complexity. Using Sequence Diagrams, you can explore additional usage scenarios and enrich your understanding of the distributed architecture while continuing to communicate visually.
This post takes a sample architecture and iteratively builds out a set of Sequence Diagrams. Each diagram adds to the vocabulary and graphical notation of Sequence Diagrams, then shows how the diagram deepened understanding of the architecture. All diagrams in this post were rendered from a text-based domain specific language using a diagrams-as-code tool instead of being drawn with graphical diagramming software.
Sample architecture
The architecture is based on Implementing header-based API Gateway versioning with Amazon CloudFront from the AWS Compute Blog, which uses the AWS Lambda@Edge feature to dynamically route the request to the targeted API version.
Amazon API Gateway is a fully managed service that makes it easier for developers to create, publish, maintain, monitor, and secure APIs at any scale. Amazon CloudFront is a global content delivery network (CDN) service built for high-speed, low-latency performance, security, and developer ease-of-use. Lambda@Edge lets you run functions that customize the content that CloudFront delivers.
The numbered labels in Figure 1 correspond to the following text descriptions:
- User sends an HTTP request to CloudFront, including a version header.
- CloudFront invokes the Lambda@Edge function for the Origin Request event.
- The function matches the header value to data fetched from an Amazon DynamoDB table, then modifies the Host header and path of the request and returns it to CloudFront.
- CloudFront routes the HTTP request to the matching API Gateway.
Figure 1 architecture diagram is a free-form mixture between a structure diagram and a behavior diagram. It includes structural aspects from a high-level Deployment Diagram, which depicts network connections between AWS services. It also demonstrates behavioral aspects from a Communication Diagram, which uses messages represented by arrows labeled with chronological numbers.
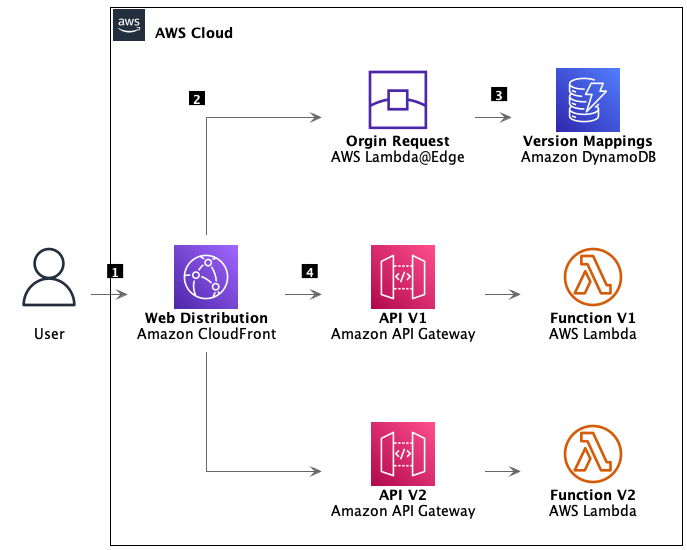
Figure 1. High-level architecture diagram
Sequence Diagrams
Sequence Diagrams are part of a subset of behavior diagrams known as interaction diagrams, which emphasis control and data flow. Sequence Diagrams model the ordered logic of usage scenarios in a consistent visual manner and capture detailed behaviors. I use this diagram type for analysis and design purposes and to validate my assumptions about data flows in distributed architectures. Let’s investigate the system use case where the API is called without a header indicating the requested version using a Sequence Diagram.
Examining the system use case
In Figure 2, User, Web Distribution, and Origin Request are each actors or system participants. The parallel vertical lines underneath these participants are lifelines. The horizontal arrows between participants are messages, with the arrowhead indicating message direction. Messages are arranged in time sequence from top to bottom. The dashed lines represent reply messages. The text inside guillemets («like this») indicate a stereotype, which refines the meaning of a model element. The rectangle with the bent upper-right corner is a note containing additional useful information.
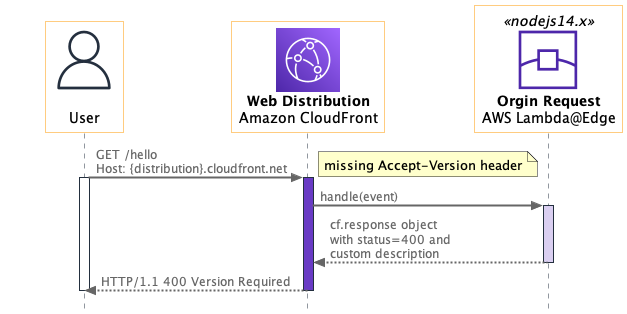
Figure 2. Missing accept-version header
The message from User to Web Distribution lacks any HTTP header that indicates the version, which precipitates the choice of Accept-Version for this name. The return message requires a decision about HTTP status code for this error case (400). The interaction with the Origin Request prompts a selection of Lambda runtimes (nodejs14.x) and understanding the programming model for generating an HTTP response for this request.
Designing the interaction
Next, let’s design the interaction when the Accept-Version header is present, but the corresponding value is not found in the Version Mappings table.
Figure 3 adds new notation to the diagram. The rectangle with “opt” in the upper-left corner and bolded text inside square brackets is an interaction fragment. The “opt” indicates this operation is an option based on the constraint (or guard) that “version mappings not cached” is true.
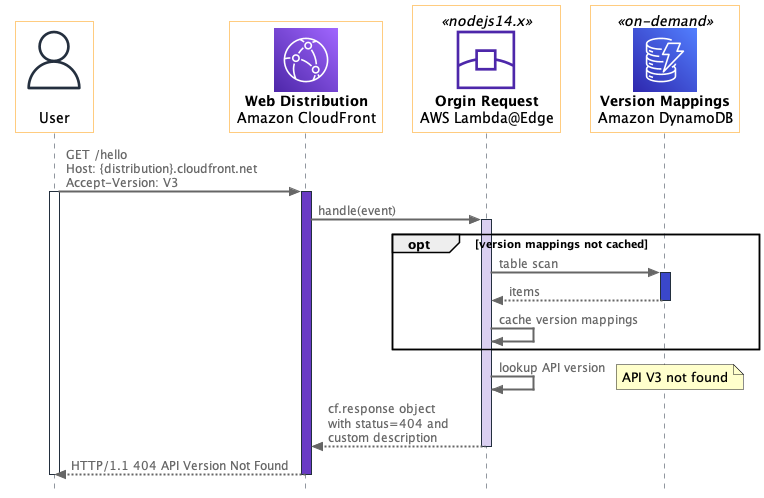
Figure 3. API version not found
A DynamoDB scan operation on every request consumes table read capacity. Caching Version Mappings data inside the Lambda@Edge function’s memory optimizes for on-demand capacity mode. The «on-demand» stereotype on the DynamoDB participant succinctly communicates this decision. The “API V3 not found” note on Figure 3 provides clarity to the reader. The HTTP status code for this error case is decided as 404 with a custom description of “API Version Not Found.”
Now, let’s design the interaction where the API version is found and the caller receives a successful response.
Figure 4 is similar to Figure 3 up until the note, which now indicates “API V1 found.” Consulting the documentation for Writing functions for Lambda@Edge, the request event is updated with the HTTP Host header and path for the “API V1” Amazon API Gateway.
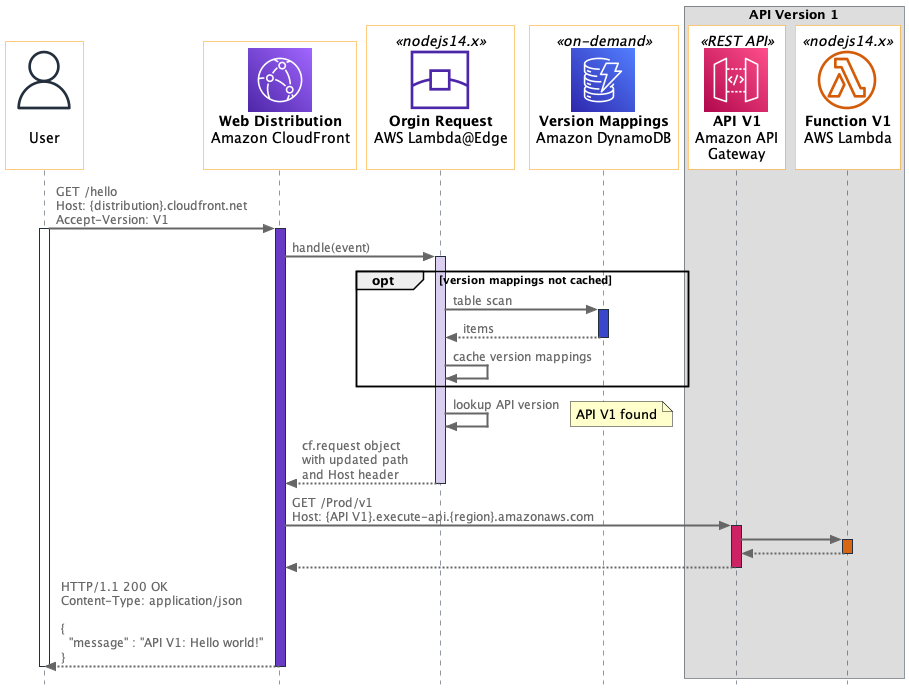
Figure 4. API version found
Instead of three separate diagrams for these individual scenarios, a single, combined diagram can represent the entire set of use cases. Figure 5 includes two new “alt” interaction fragments that represent choices of alternative behaviors.
The first “alt” has a guard of “missing Accept-Version header” mapping to our Figure 2 use case. The “else” guard encompasses the remaining use cases containing a second “alt” splitting where Figure 3 and Figure 4 diverge. That “version not found” guard is the Figure 3 use case returning the 404, while that “else” guard is the Figure 4 success condition. The added notes improve visual clarity.
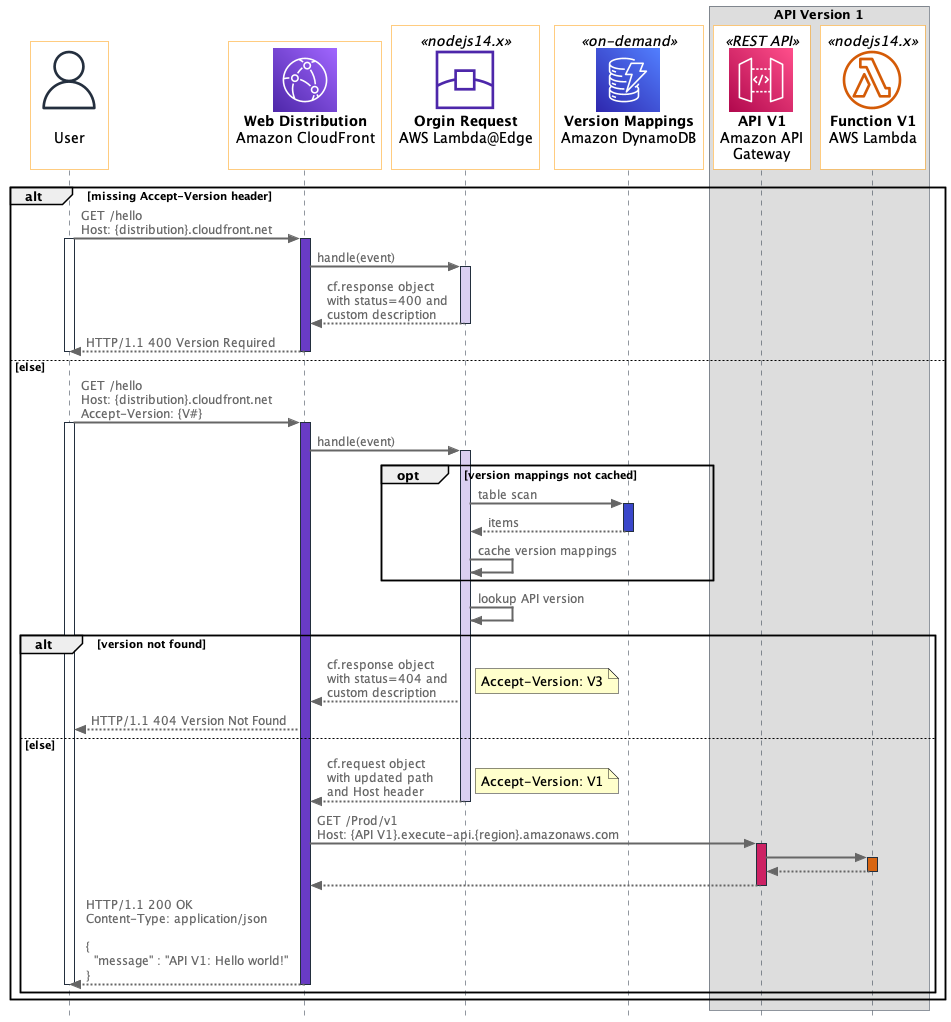
Figure 5. Header-based API Gateway versioning with CloudFront
Diagrams as code
After diagrams are created, the next question is where to save them and how to keep them updated. Because diagrams-as-code use text-based files, they can be stored and versioned in the same source control system as application code. Also consider an architectural decision record (ADR) process to document and communicate architecturally significant decisions. Then as application code is updated, team members can revise both the ADR narrative and the text-based diagram source. Up-to-date documentation is important for operationally supporting production deployments, and these diagrams quickly provide a visual understanding of system component interactions.
Conclusion
This post started with a high-level architecture diagram and ended with an additional Sequence Diagram that captures multiple usage scenarios. This improved understanding of the system design across success and error use cases. Focusing on system interactions prior to coding facilitates the interface definition and emergent properties discovery, before thinking in terms of programming language specific constructs and SDKs.
Experiment to see if Sequence Diagrams improve the analysis and design phase of your next project. View additional examples of diagrams-as-code from the AWS Icons for PlantUML GitHub repository. The Workload Discovery on AWS solution can even build detailed architecture diagrams of your workloads based on live data from AWS.
For vetted architecture solutions and reference architecture diagrams, visit the AWS Architecture Center. For more serverless learning resources, visit Serverless Land.
Find more examples of how architects use sequence diagrams here
Try ZenUML now!
Zenuml detailed feature roadmap available here.

