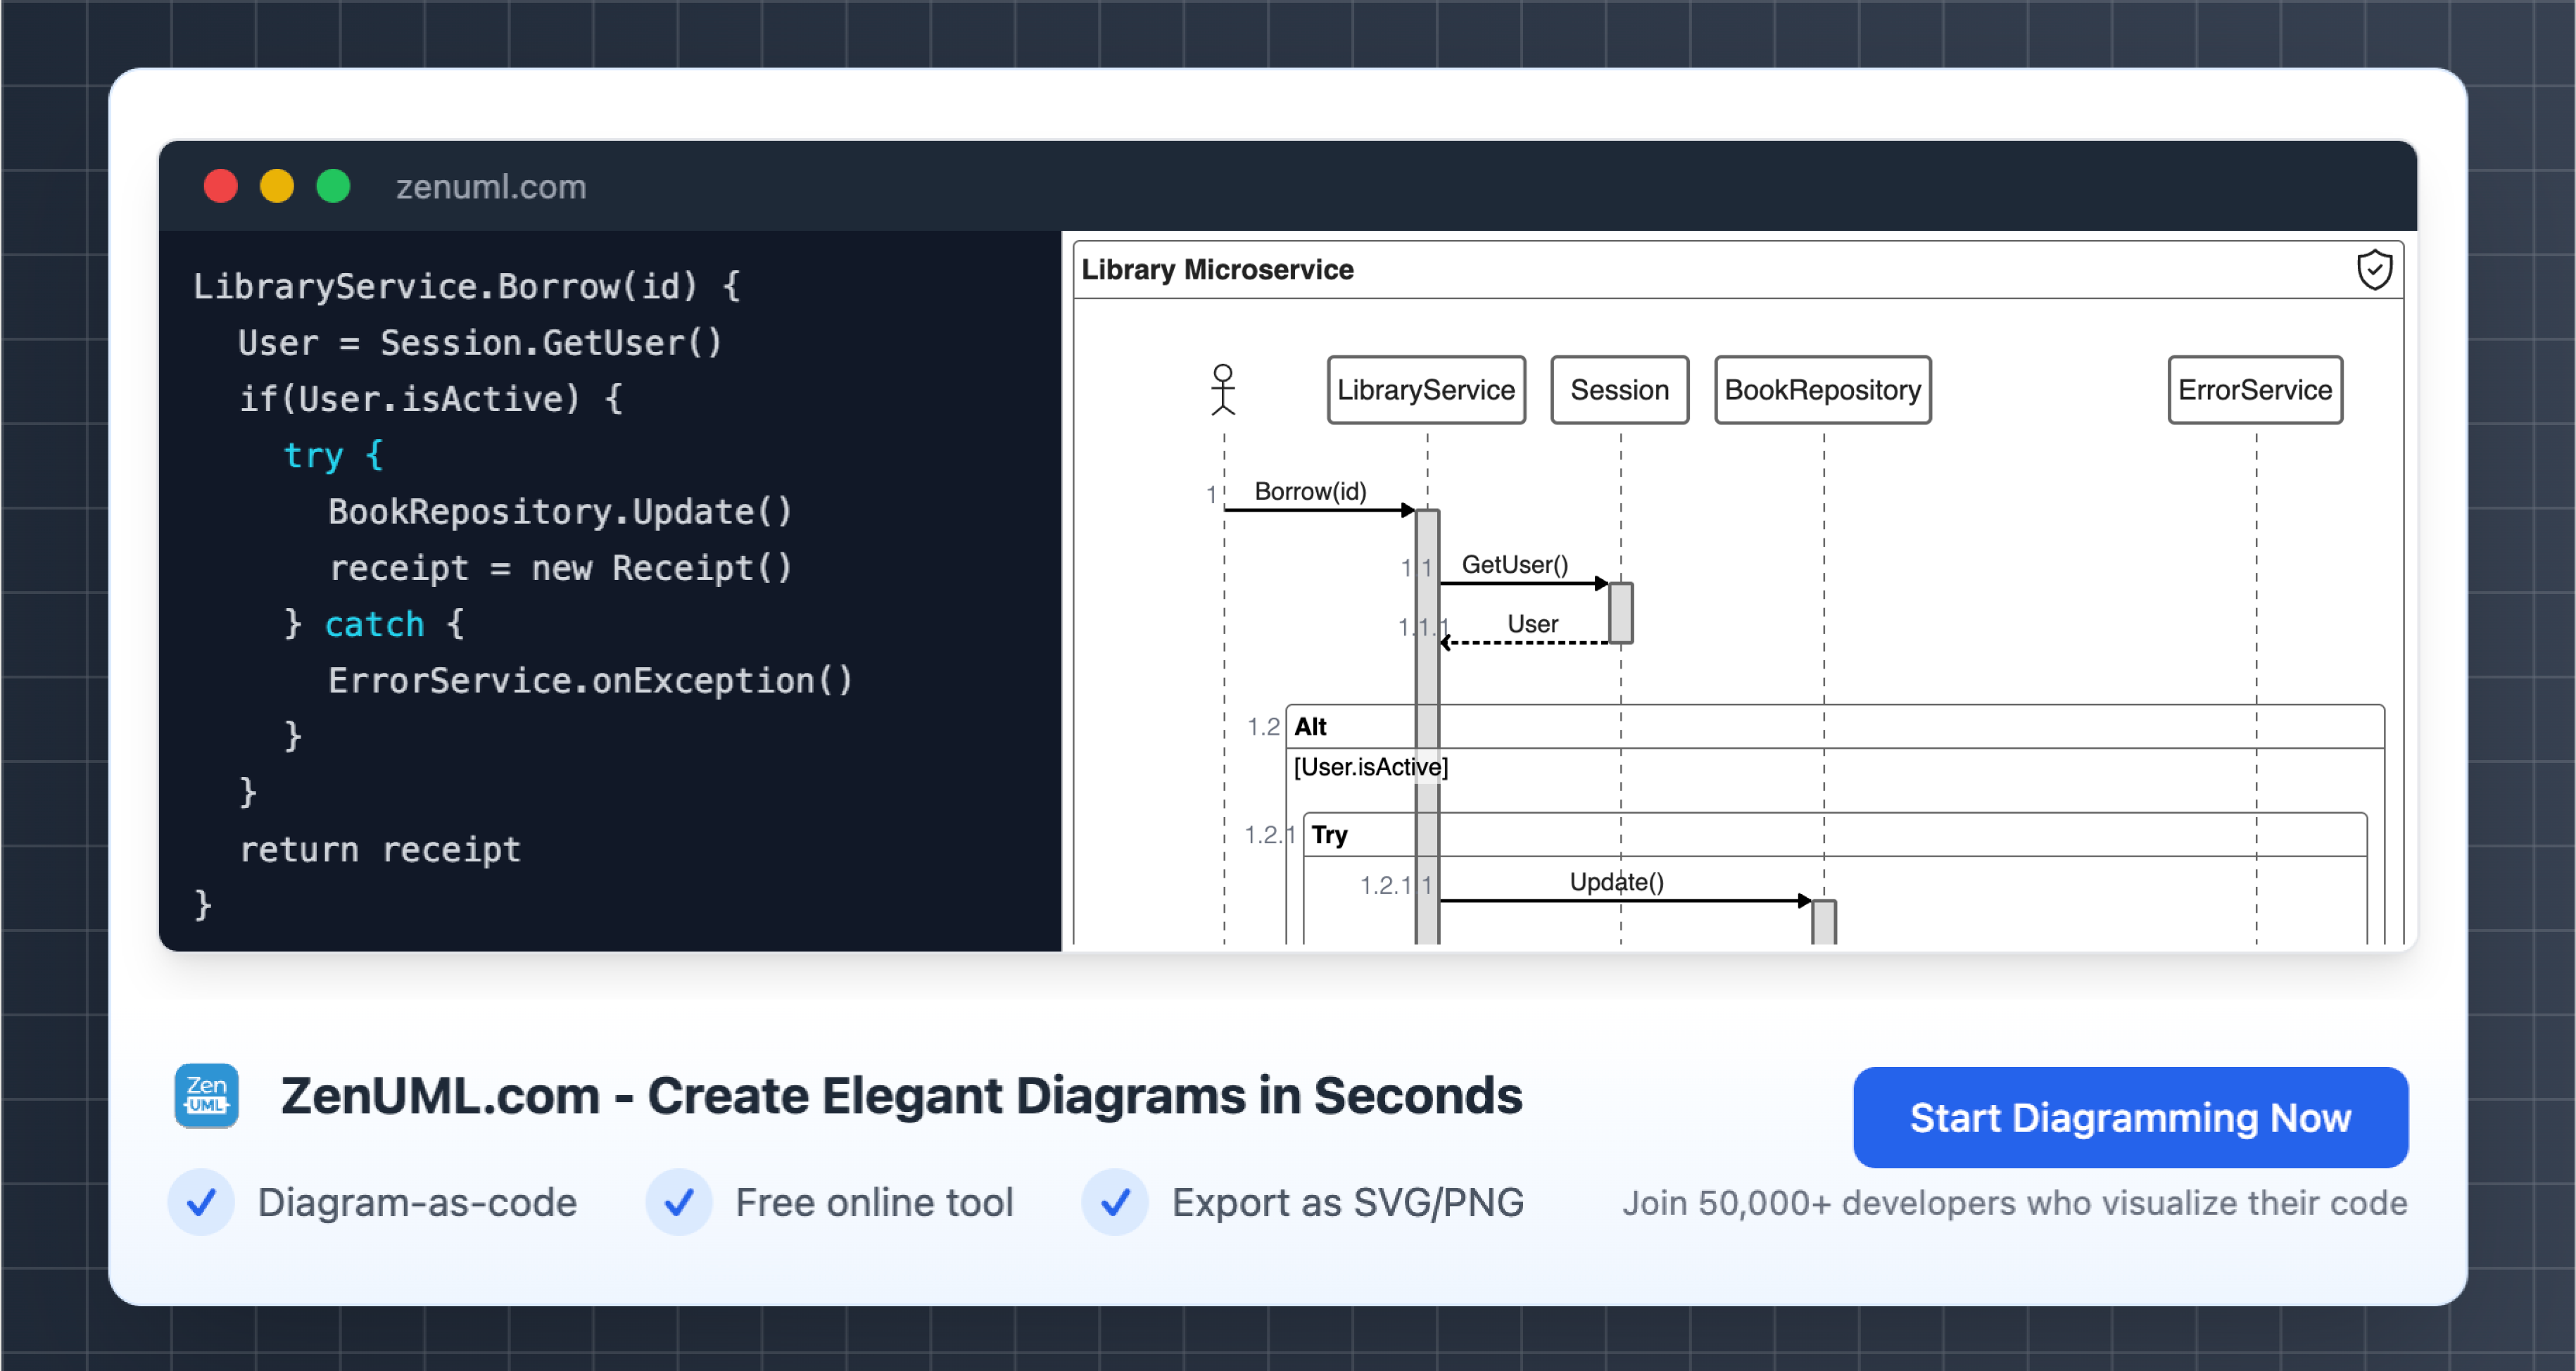
Introduction
In the dynamic world of business analysis, visual representations are becoming increasingly crucial in communicating and streamlining complex information. One of the most potent tools to emerge in recent years is the sequence diagram. Widely used across industries, sequence diagrams serve as a cornerstone for understanding system interactions, business processes, and identifying integration gaps.
According to recent studies, over 65% of analysts and developers report improved system design efficiency and stakeholder clarity when implementing sequence diagrams. The question is no longer "What is a sequence diagram?" but instead "How can I use sequence diagrams to propel my business analysis to the next level?"
This blog post demystifies sequence diagrams, explores their building blocks, showcases their benefits, and provides practical use cases supported by ZenUML.js examples. Dive in to discover how sequence diagrams can elevate your approach to integration and process optimization!
What Are Sequence Diagrams?
A sequence diagram is a type of Unified Modeling Language (UML) diagram that visually represents how objects interact within a system over time. It illustrates the sequential flow of communication between entities such as users, systems, and processes.
At their core, these diagrams contain elements such as actors, lifelines, messages, and activations, arranged systematically to depict workflows or interaction behavior.
Why Sequence Diagrams Matter:
- They provide a clear view of scenario workflows and interface handshakes.
- They allow non-technical stakeholders to grasp organizational operations seamlessly.
- They enable analysts and developers to spot potential pitfalls during integration stages.
Consider the following ZenUML.js example to demonstrate a basic e-commerce sequence flow:
1. The Anatomy of a Sequence Diagram
To harness the power of sequence diagrams, it's essential to understand their core components:
- Actors: Represent individuals or systems interacting with the investigated process (e.g., customers, applications, or third-party services).
- Lifelines: Represent the timeline of each actor's participation, denoted by vertical dashed lines.
- Messages: Represent the interactions between lifelines, denoting requests, responses, or data transfers.
- Activations: Highlight periods when an actor or system is actively processing a task.
Key Characteristics:
- Time Sequential: Lower interactions occur later in the workflow.
- Synchronous vs. Asynchronous: Some interactions await feedback, whereas others proceed without delays.
- Visual Complexity: Simplifies intricate operations by compartmentalizing system components.
Imagine you are a business analyst designing an IT help desk system's workflow. Here’s another ZenUML.js sequence diagram example:
This breakdown emphasizes role delineation, making complex processes simpler to comprehend and model.
2. The Benefits of Sequence Diagrams for Business Analysis
When integrated into the business analysis arsenal, sequence diagrams offer unmatched benefits:
1. Clearer Communication
These diagrams bridge the gap between technical and business teams. In fact, according to a 2022 study, 74% of teams found visual aids like sequence diagrams significantly improved cross-functional communication.
2. Early Problem Detection
By mapping processes, analysts can spot bottlenecks or inefficiencies before they become costly mistakes. For example, identifying redundant messages in a high-frequency transactional system can save both time and resources.
3. Streamlined Documentation
Sequence diagrams double as living documentation. They adapt quickly when processes evolve, ensuring stakeholders always have the most up-to-date view of workflows.
4. Improved Stakeholder Buy-In
When stakeholders are handed a clear, visual representation of an integration or process, they are more likely to approve the proposed solutions. Simple visuals reduce the cognitive load, enabling quicker decisions aligned with organizational goals.
3. Practical Use Cases of Sequence Diagrams in Integration
A. System Integration
Sequence diagrams shine during integration scenarios. Consider a logistics company tracking package deliveries. The backend developers, UI designers, and transport teams must collaborate to ensure seamless communication between front-end apps, middleware, and APIs.
Diagram Example:
B. Customer Journey Mapping
E-commerce websites, subscription services, and CRMs use sequence diagrams to capture customer touchpoints. These workflow insights improve UX/UI designs and marketing automation strategies.
C. Resolving Integration Challenges
Whenever two systems fail to communicate, the sequence diagram acts as a troubleshooting ally. For example:
- Missing API messages or unacceptable response times.
- Data mismatches causing integration errors.
Real-life scenarios demonstrate how sequence diagrams reduce resolution time by 40% on average, translating to huge savings on operational costs.
4. Using ZenUML.js for Seamless Diagram Creation
While traditional UML tools are available, ZenUML.js has emerged as a lightweight, code-driven alternative. Analysts enjoy its simplicity and flexibility, especially when embedding diagrams into documentation or presentations.
Why Choose ZenUML.js?
- Efficient: No need for bulky software installations.
- Versatile: Supports dynamic rendering directly in websites or apps.
- Accessible: Beginner-friendly syntax, perfect for non-designers.
Example of ZenUML.js in Banking Integration Workflow:
Use cases like this improve banking systems' accuracy and deposit customer trust.
5. Building a Future with Sequence Diagrams
Companies across industries are harnessing the power of diagrams to optimize operations. With trends leaning toward automation, escalating demand for API integrations, and the need for multi-team collaboration, sequence diagrams are positioned to become the next big thing in business strategy.
Recent surveys predict that diagram usage in system integrations will grow by 30% annually through 2025, a testament to their rising popularity among analysts and developers. Whether you are managing software implementation, mapping user journeys, or untangling communication issues, sequence diagrams are your go-to solution for clarity.
Conclusion
As one of the most versatile tools in business analysis, sequence diagrams provide a structured, visual way to analyze complex workflows and system interactions. They simplify integration journeys, ensure seamless communication between teams, and solve challenges at the core.
Are you ready to bring the next big thing into your analysis toolkit? Start incorporating sequence diagrams into your projects and watch as your processes become more streamlined, collaborative, and impactful.
Did you find this guide helpful? Share your thoughts in the comments below or let us know how you’ve used sequence diagrams in your work!
Try ZenUML now!
Zenuml detailed feature roadmap available here.

