Introduction
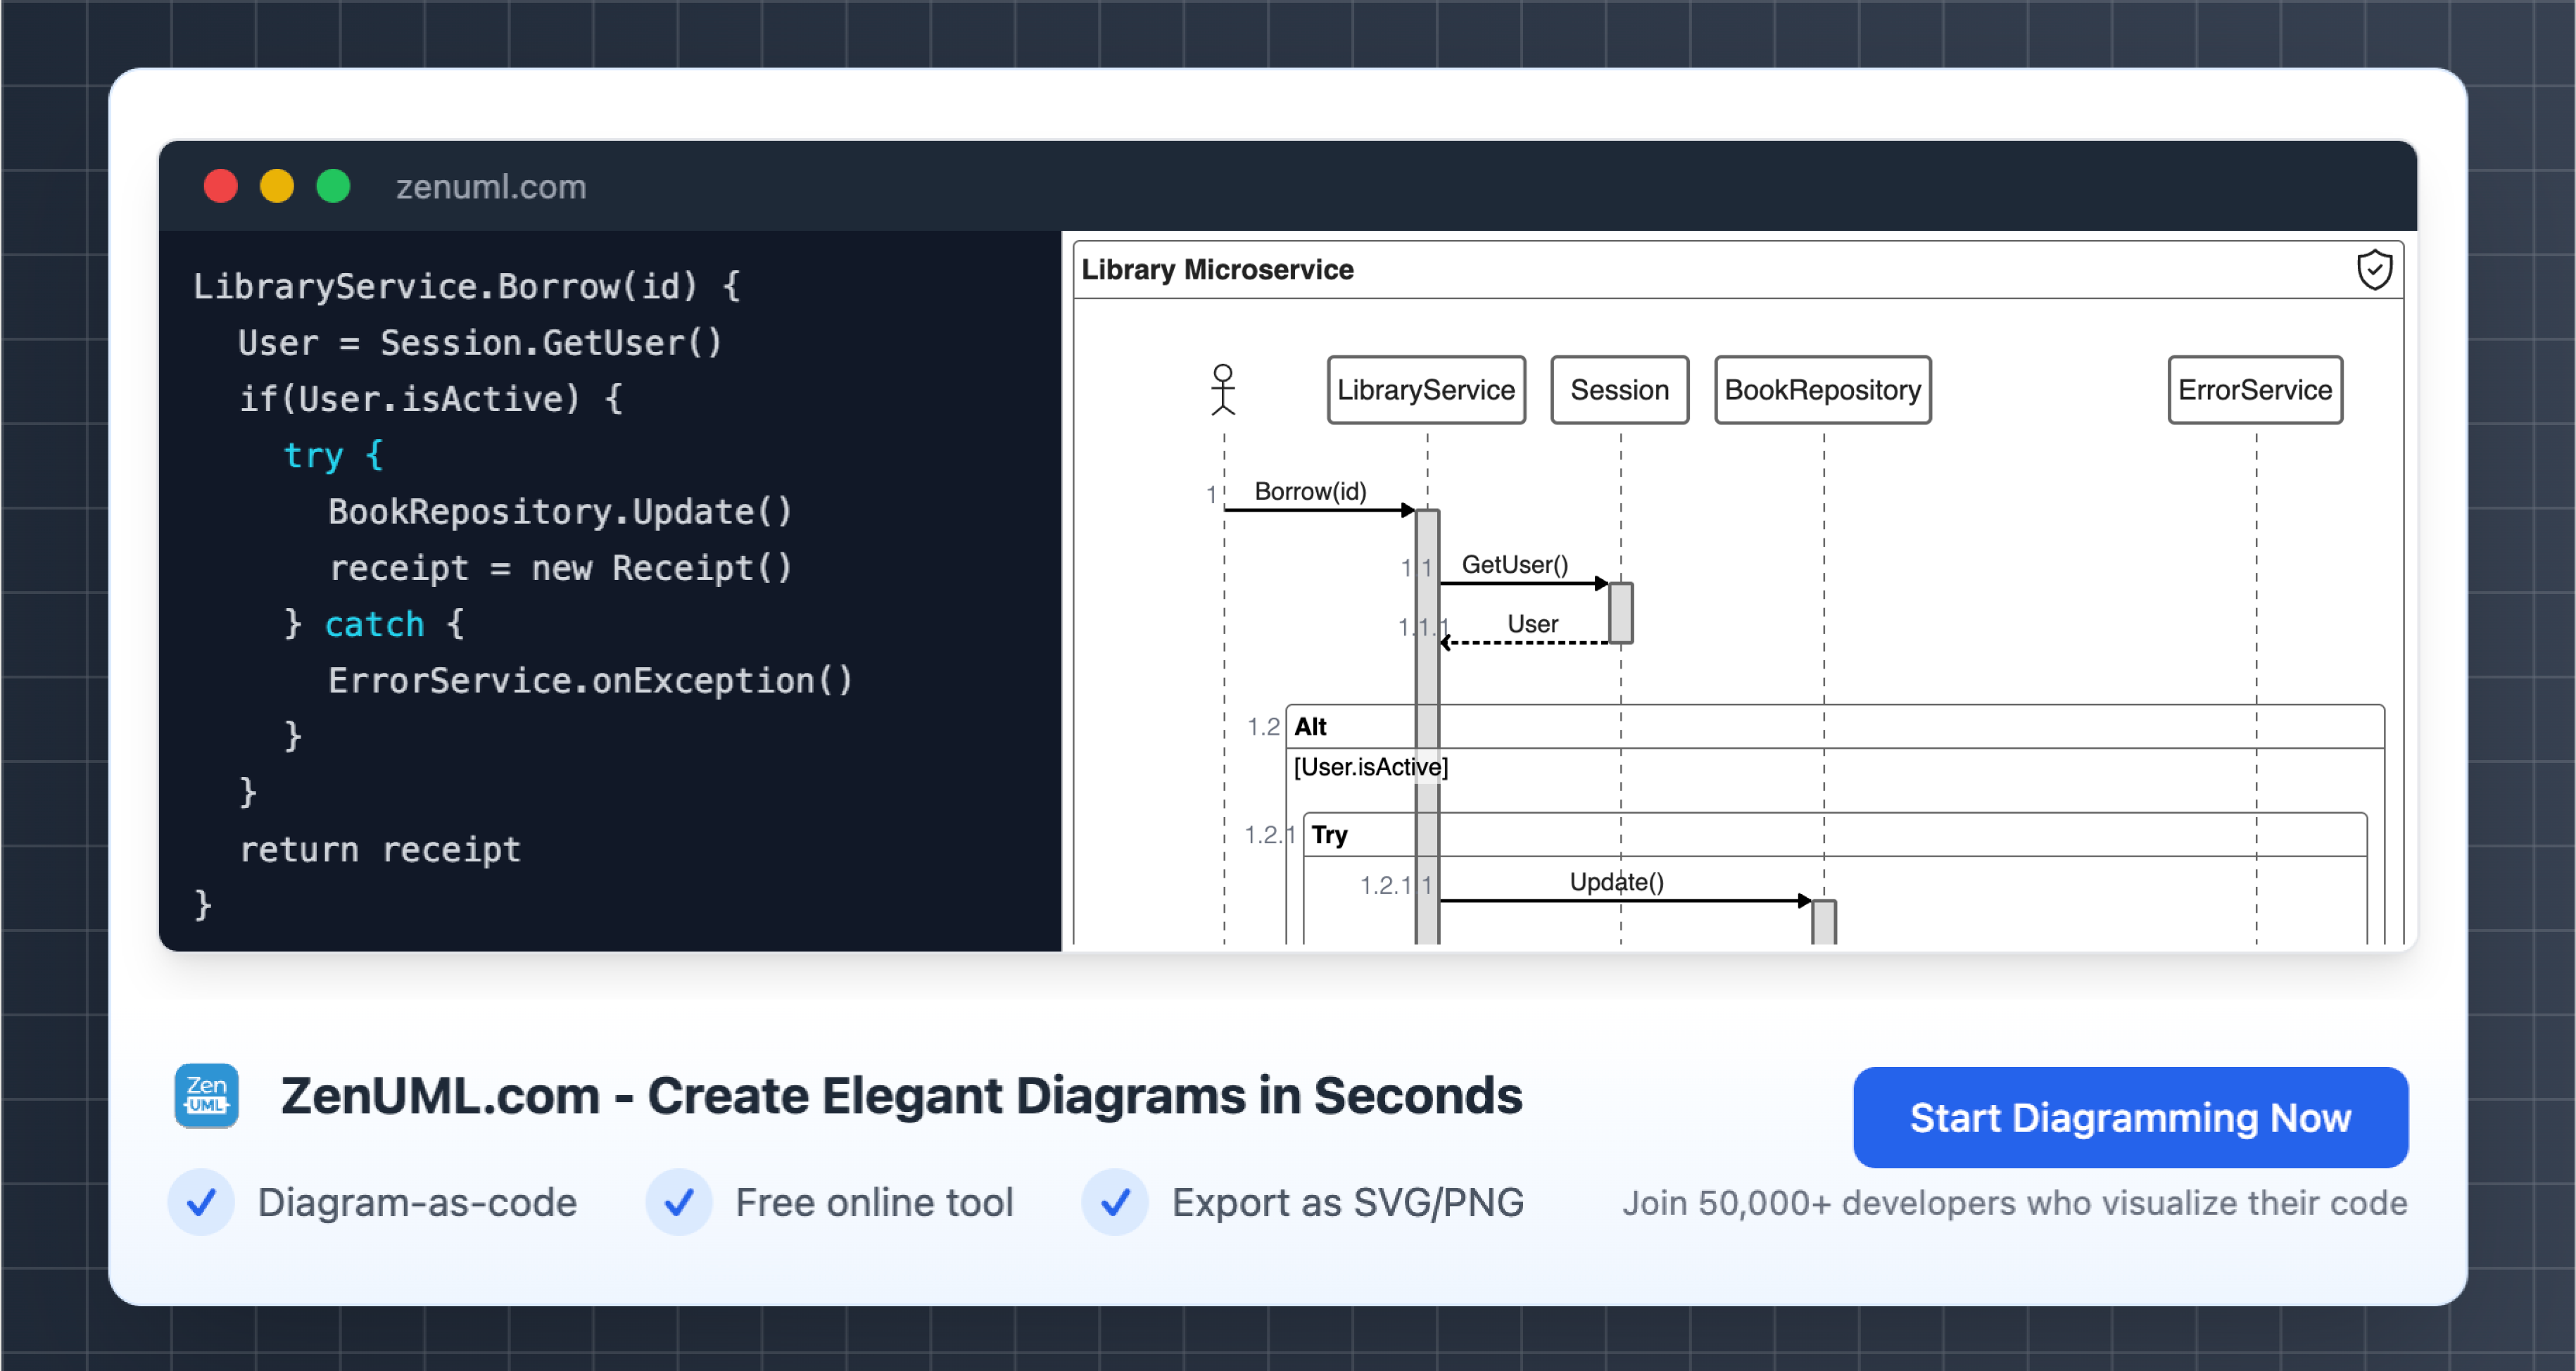
Software development is complex, and visual tools like sequence diagrams simplify how developers plan and understand the interactions within systems. A sequence diagram showcases the flow and communication between objects or components in a system over time. When paired with JavaScript, you can create dynamic and effective diagrams to communicate your ideas.
JavaScript tools such as ZenUML.js have emerged as powerful ways to create professional visuals without painstakingly sketching diagrams manually. By harnessing the potential of JavaScript, you can streamline your software development process to improve accuracy and save time. Did you know that 83% of software teams find visual representations like sequence diagrams boost collaboration and reduce misunderstandings?
This blog post will walk you through best practices for creating sequence diagrams using JavaScript tools and illustrate examples using ZenUML.js. By the end, you’ll be equipped with actionable techniques to design clear, compelling visuals. Let’s begin!
Why Choose JavaScript for Sequence Diagrams?
Simplicity and Flexibility
JavaScript offers simplicity and flexibility that many static software solutions lack. For example, tools like ZenUML.js make writing and updating diagrams as simple as editing text in a script. Unlike traditional diagram tools, this approach minimizes human errors when making frequent updates.
- Quick updates: Teams can make edits without opening complex design software.
- Dynamic rendering: Browser-based rendering makes diagrams interactive.
- Team collaboration: Easily share code files across teams.
Imagine handling a visual design change in a large system where actors, processes, or interactions frequently evolve. JavaScript-based tools let you update only the corresponding text lines, leaving the rest intact—a big win for organizational efficiency.
Cross-Platform Compatibility
JavaScript ensures diagrams are platform-agnostic. Since diagrams generated use standard web technologies (HTML, CSS, SVG), you can integrate visuals seamlessly into web-based documentation platforms like Confluence, GitHub ReadMe, or project management dashboards such as Jira.
For instance, tools powered by JS can render diagrams live in a browser, making it easier for stakeholders to collaborate regardless of operating systems.
Performance Statistics
- Developers save an average of 25-30% of time using JavaScript-based tools for diagram creation over traditional graphic software.
- Browser-rendered sequence diagrams reduce the chance of static file versioning by at least 40%.
The Role of ZenUML.js in Sequence Diagrams
ZenUML.js is a lightweight, open-source library that turns plain-text descriptions into visually appealing diagrams. Using its syntax, teams can generate sequence diagrams, Gantt charts, and more—an essential technology for anyone serious about programming collaborations.
Best Practices for Creating Sequence Diagrams with JavaScript
1. Start with Role Definition
Before plotting a sequence diagram, identify all actors and their roles. These could be users, external systems, APIs, or internal services that interact within your application.
For example, consider this scenario: You’re developing an authentication system. Your actors could include:
- User
- Frontend Application
- Backend Server
- Authentication Service
Here’s how the sequence might look in ZenUML.js:
Having an initial list of actors ensures clarity in diagram planning. Missing actors mid-way often leads to diagram revisions that steal valuable development time.
2. Focus on Communication Flow
Sequence diagrams thrive on interaction clarity. Each message or arrow represents a specific operation or query between components. Maintain a logical order, avoiding tangled or crossing arrows that confuse readers.
Tips:
- Use standard verbs like “Request,” “Response,” or “Validate” to label arrows.
- Group repeated actions logically. Highlight loops or shared processes with clear syntax in ZenUML.js.
Example of a loop in ZenUML.js:
This best practice avoids redundancy while also clearly marking repetitive workflows.
3. Keep Diagrams Modular
Avoid cramming too much detail into one diagram. For better readability, split complex systems into modular components. People read sequence diagrams for high-level clarity, not to parse every minor detail.
Example:
For a full-stack architecture featuring microservices, make separate diagrams focusing on distinct flows:
- User’s sign-up journey
- System interaction with database APIs
- Notification service workflows
Example Modular Perspective:
Imagine you need to visualize a notification service workflow. Represent it individually:
By breaking flows into smaller diagrams, it’s easier for stakeholders to grasp specific workflows without being overwhelmed.
4. Consistency in Styling
While JavaScript tools like ZenUML.js don't prioritize aesthetic design, maintaining stylistic consistency improves readability across all diagrams.
Tips for Style Consistency:
- Use consistent participant names: Stick to single words (e.g., “Frontend,” “User”) or proper casing across diagrams.
- Align arrows logically—connect messages according to interaction order.
- For larger projects, maintain a set diagram guideline.
Advanced Features of ZenUML.js (Optional)
ZenUML.js elevates your sequence diagrams by including:
- Conditions and Branching: Represent if-else scenarios.
- Cross-system workflows: Add messages crossing internal teams or integrated APIs.
- Prototyping Documentation: Utilize these diagrams as hand-offs between devs or QAs.
Here’s an example of branching:
This conditional flow diagram ensures team members understand how requests diverge.
Key Benefits of Adopting JavaScript for Sequence Diagrams
- 30% fewer cross-team miscommunications through functional diagrams.
- Inline editing with tools like ZenUML saves countless working hours weekly.
- Integrate diagrams directly into technical documentation with code-first methods.
Developers using sequence diagrams often report higher team outcomes for complex software projects. Visualization reduces ambiguous instructions that may snowball into bug-prone code.
Conclusion
Creating compelling sequence diagrams is no longer a tedious chore. With JavaScript-based tools like ZenUML.js, you can design clean, modular, and interactive diagrams to streamline your development workflow. Use the best practices highlighted here to make your diagrams not just functional but also a vital tool for team clarity.
By leveraging the potential of JavaScript, you’ll save time, avoid manual errors, and empower your team to focus on creating innovative solutions. Whether you're illustrating simple API interactions or designing the foundation for complex systems, mastery over diagramming pays enormous dividends.
Do you have experiences with sequence diagrams or ZenUML.js? Let us know your thoughts in the comments section below—what challenges have you faced, and which tips worked best for you?
Try ZenUML now!
Zenuml detailed feature roadmap available here.

