Introduction
In the fast-paced digital landscape, where businesses strive to stay agile and responsive, the event-driven system design approach has emerged as a powerful and adaptable architectural pattern. By leveraging the power of events, organizations can build systems that are scalable, flexible, and capable of reacting to changing requirements with ease. In this blog post, we will explore practical examples of event-driven system design, utilizing the versatility of sequence diagrams to illustrate the underlying concepts.
Event-driven architecture (EDA) is a paradigm that emphasizes the production, detection, consumption, and reaction to events. In this approach, components of a system communicate asynchronously, with events serving as the primary means of information exchange. This decoupled nature allows for greater scalability, improved responsiveness, and easier integration of diverse system components.
The Power of Sequence Diagrams
Sequence diagrams, a staple of the Unified Modeling Language (UML), provide a visual representation of the interactions between various entities within a system over time. These diagrams effectively capture the flow of messages and the order in which they are exchanged, making them an invaluable tool for understanding and communicating event-driven system design.
By using sequence diagrams, we can clearly illustrate the event-driven nature of a system, highlighting the asynchronous interactions and the processing of events. This visual representation aids in understanding the overall system architecture, identifying potential bottlenecks, and facilitating effective communication among stakeholders.
Practical Examples
To demonstrate the power of event-driven system design using sequence diagrams, let's explore a few practical examples:
Example 1: Order Processing in an E-commerce Platform
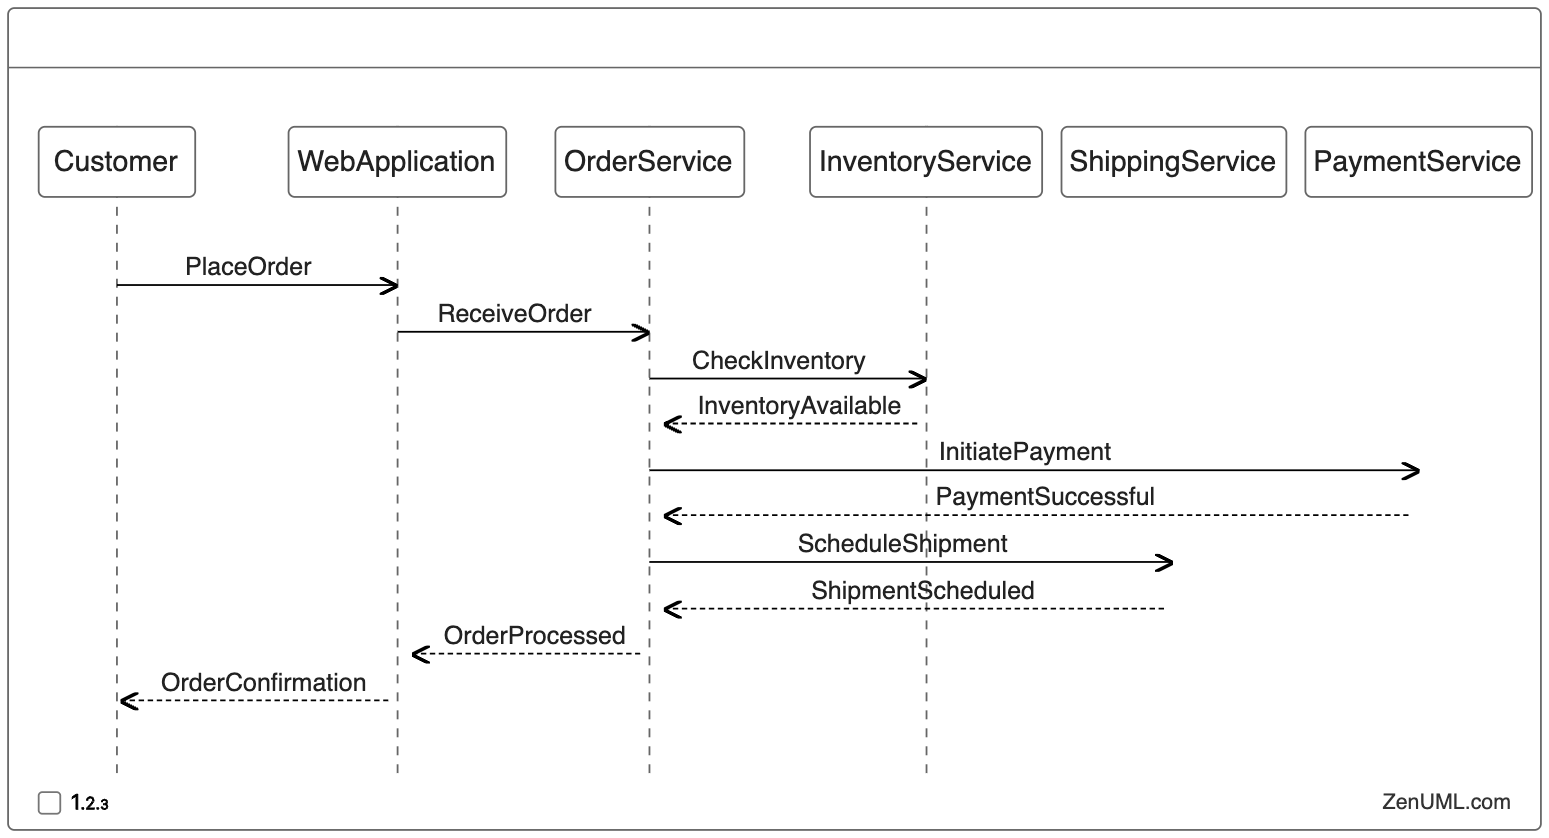
In this example, we'll consider an e-commerce platform that processes customer orders. The key events and interactions involved in this process can be depicted using a sequence diagram.

In this sequence diagram, we can see the flow of events and interactions between the various components of the e-commerce platform. The customer initiates the order, which is then processed by the Order Service. The Order Service interacts with the Inventory Service, Payment Service, and Shipping Service to complete the order processing. Each of these services is decoupled and responds to events, allowing for a flexible and scalable system design.
Example 2: Notification System in a Social Media Platform
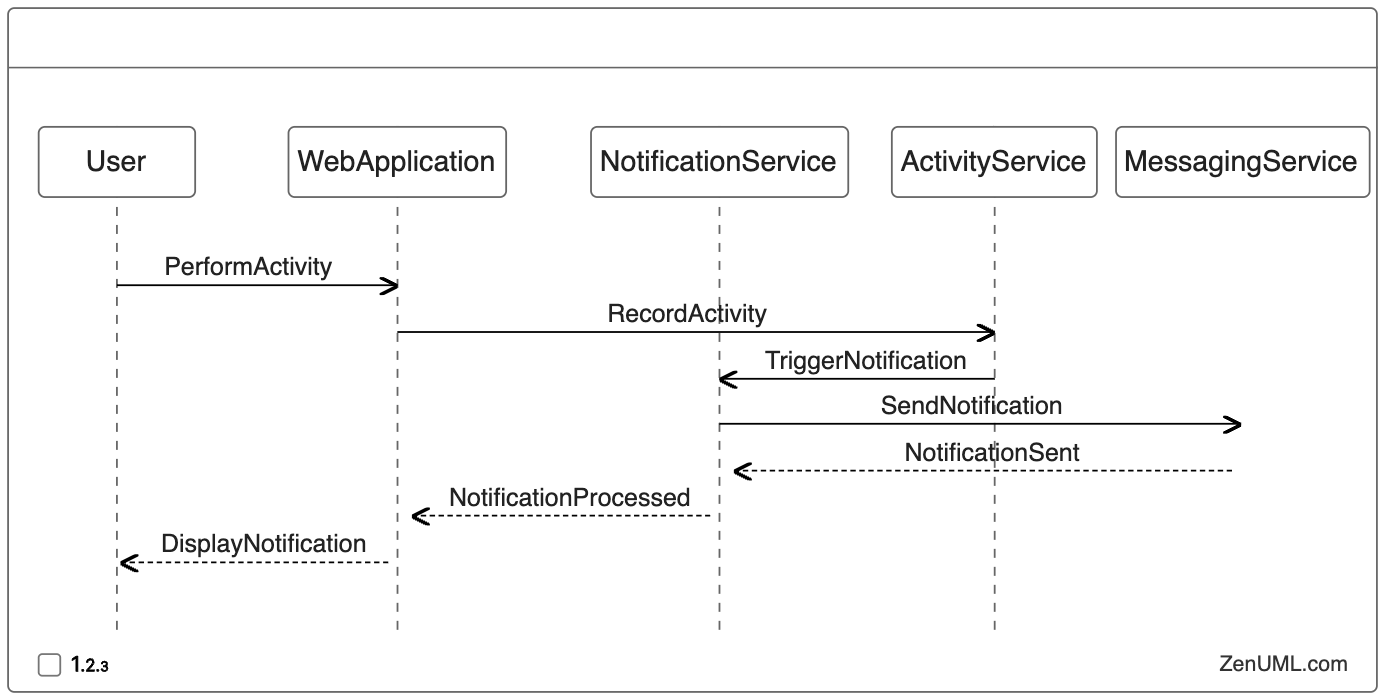
In this example, we'll explore a notification system within a social media platform, where users receive updates on activities related to their accounts.

In this sequence diagram, we can see the flow of events when a user performs an activity on the social media platform. The activity is recorded by the Activity Service, which then triggers a notification event. The Notification Service receives this event, processes it, and interacts with the Messaging Service to send the notification to the user. The decoupled nature of the system allows for easy scaling and the addition of new notification types or communication channels without affecting the core system components.
Example 3: IoT-based Smart Home Automation
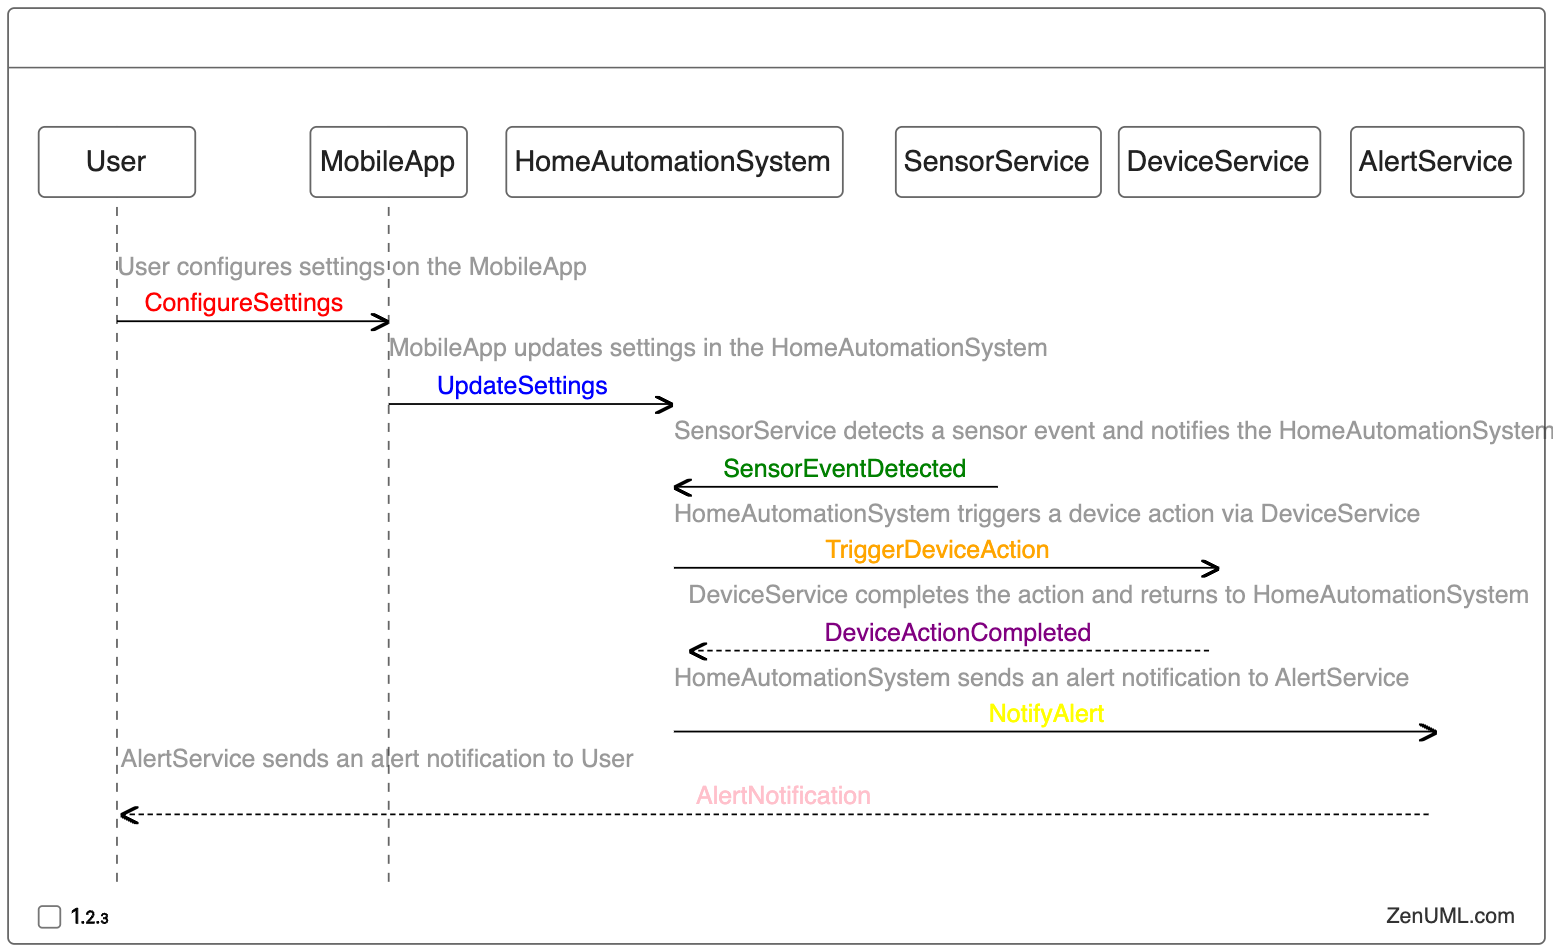
In this example, we'll explore a smart home automation system that responds to various sensor events.

In this sequence diagram, we can see the flow of events in a smart home automation system. The user configures settings through a mobile app, which updates the Home Automation System. When a sensor event is detected, the Sensor Service notifies the Home Automation System, which then triggers a device action through the Device Service. If necessary, the Home Automation System also sends an alert to the Alert Service, which notifies the user. The event-driven nature of this system allows for seamless integration of various sensors and devices, enabling a responsive and adaptable smart home experience.
Conclusion
In this blog post, we've explored the practical applications of event-driven system design using the power of sequence diagrams. By visualizing the interactions and flow of events, we've gained a deeper understanding of how this architectural approach can be applied to real-world scenarios, such as order processing in e-commerce, notification systems in social media, and IoT-based smart home automation.
The versatility of sequence diagrams, combined with the flexibility of event-driven architecture, showcases the significant advantages of this design paradigm. It enables scalable, responsive, and adaptable systems that can thrive in the ever-changing digital landscape.
As you continue to explore and implement event-driven system designs, remember to leverage the power of sequence diagrams to communicate, collaborate, and refine your architectural decisions. The visual representation they provide can be invaluable in fostering a shared understanding among stakeholders and driving the success of your projects.
We encourage you to explore these examples further, experiment with event-driven design patterns, and share your own practical experiences in the comments below. Together, we can continue to push the boundaries of what's possible in the world of modern, scalable, and responsive system design.
Try ZenUML now!
Zenuml detailed feature roadmap available here.

