
Introduction
In the ever-evolving world of software development, the integration of DevOps practices has become crucial for organizations to deliver applications and services efficiently, reliably, and at a faster pace. One of the essential tools in the DevOps toolbox is the sequence diagram, a visual representation of the interactions and communication between different components or entities within a system.
Sequence diagrams are a powerful tool for understanding the flow of events and the interactions between various elements in a software system. In the context of DevOps, these diagrams can be used to model and document the various stages of the software development lifecycle, from planning and development to deployment and monitoring.
The Role of Sequence Diagrams in DevOps
Sequence diagrams play a vital role in the DevOps ecosystem by providing a clear and concise way to visualize and communicate the various processes and interactions involved in the development, deployment, and maintenance of software applications. Here are some of the key ways in which sequence diagrams can be utilized in a DevOps environment:
1. Collaboration and Communication
Sequence diagrams serve as a common language for team members from different backgrounds, such as developers, operations engineers, and stakeholders, to understand and discuss the various components and their interactions within the software system. This facilitates better collaboration and communication, ensuring that everyone is on the same page and can collectively identify and address any potential issues.
2. Automation and Continuous Integration/Delivery
Sequence diagrams can be used to model the automated workflows and pipelines in a DevOps environment. By visualizing the sequence of steps involved in the build, test, and deployment processes, teams can identify opportunities for optimization and streamlining, ultimately improving the overall efficiency and reliability of the CI/CD (Continuous Integration/Continuous Delivery) pipeline.
3. Troubleshooting and Incident Management
When issues arise in a production environment, sequence diagrams can be used to analyze the flow of events and pinpoint the root cause of the problem. By understanding the interactions between different components, DevOps teams can quickly identify the source of the issue and take appropriate actions to resolve it, reducing downtime and ensuring a better user experience.
4. Documentation and Knowledge Sharing
Sequence diagrams can serve as valuable documentation for the software system, helping to preserve institutional knowledge and facilitate the onboarding of new team members. By providing a clear and concise visual representation of the various processes and interactions, sequence diagrams can make it easier for team members to understand and maintain the system over time.
Practical Examples of Sequence Diagrams in DevOps
To illustrate the practical applications of sequence diagrams in a DevOps environment, let's explore a few real-world examples:
Example 1: Automated Deployment Pipeline
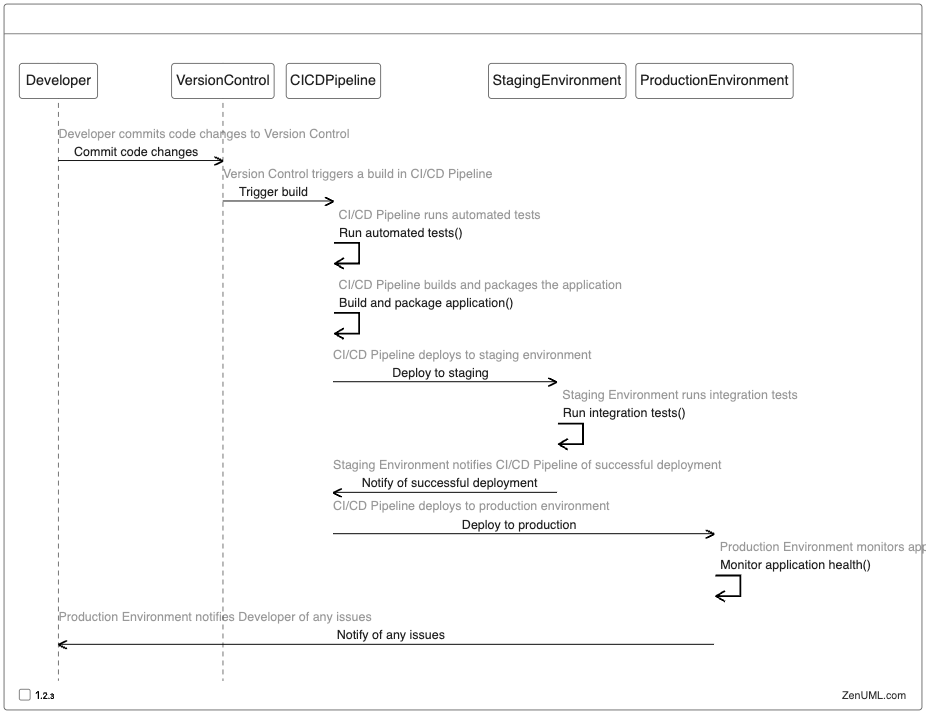
In this example, the sequence diagram depicts an automated deployment pipeline, where a developer commits code changes to the version control system, triggering a build in the CI/CD pipeline. The pipeline runs automated tests, builds and packages the application, and then deploys it to a staging environment. After successful integration testing in the staging environment, the pipeline deploys the application to the production environment, which then monitors the application's health and notifies the developer of any issues.
Example 2: Incident Management Workflow
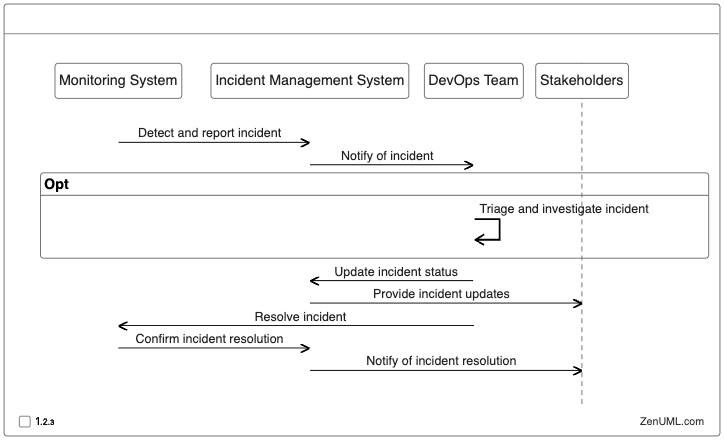
In this example, the sequence diagram illustrates an incident management workflow, where the monitoring system detects an incident and reports it to the incident management system. The incident management system then notifies the DevOps team, who triage and investigate the issue. The DevOps team updates the incident status in the incident management system, which in turn provides updates to the stakeholders. Once the DevOps team resolves the incident, the monitoring system confirms the resolution, and the incident management system notifies the stakeholders of the successful resolution.
Example 3: Microservices-based Application Deployment
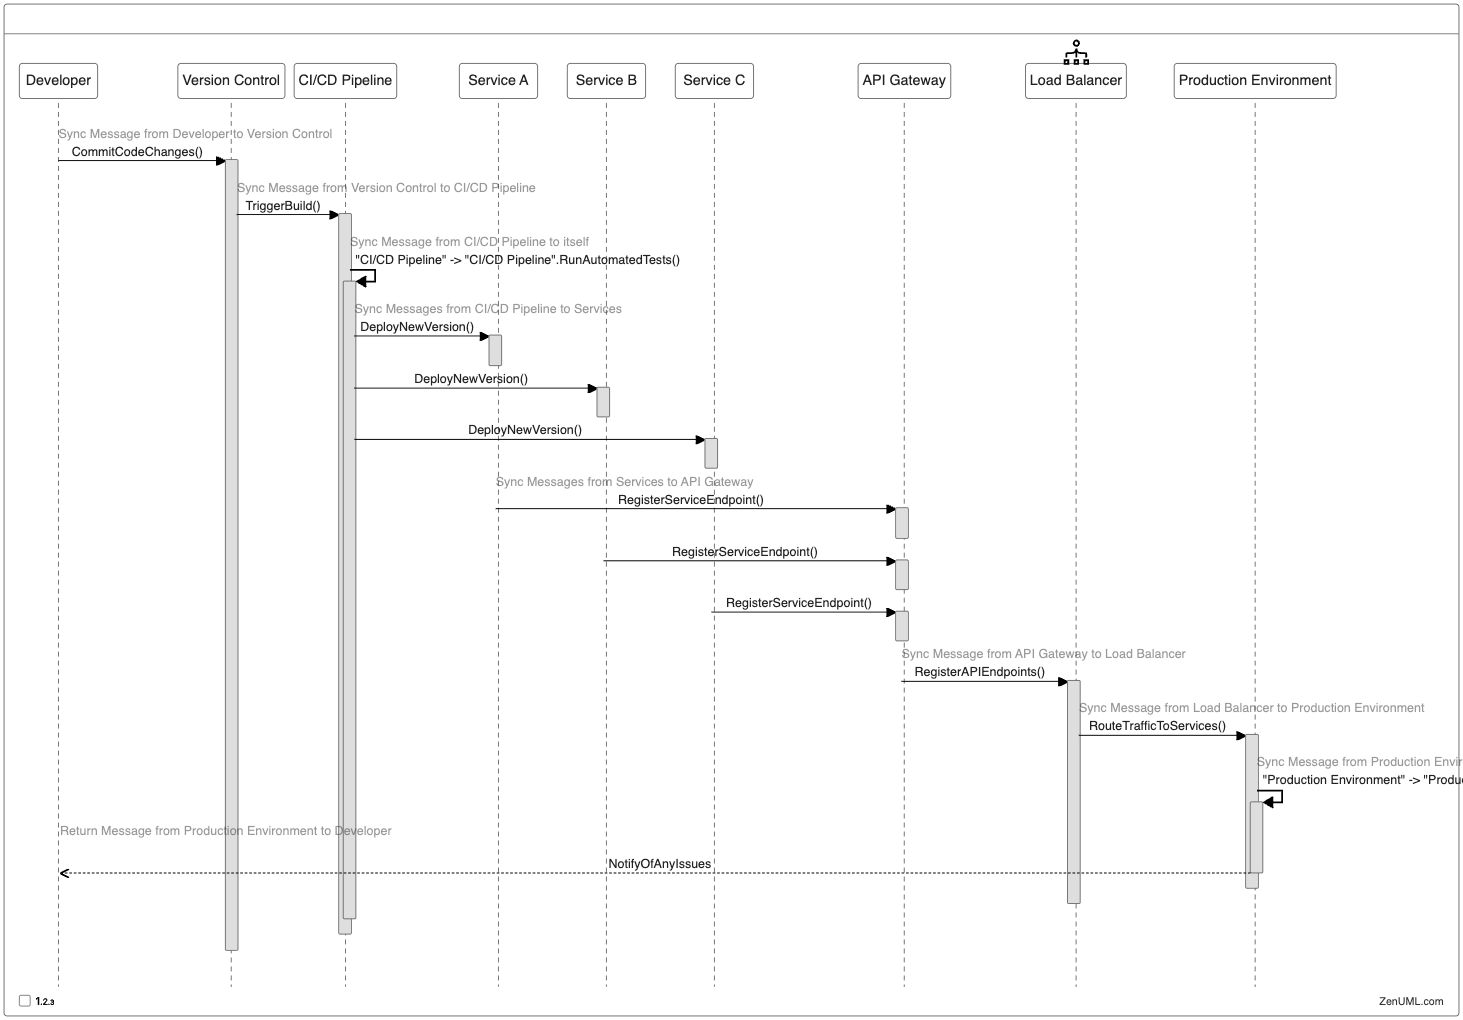
In this example, the sequence diagram depicts the deployment of a microservices-based application, where the CI/CD pipeline deploys new versions of individual services (Service A, Service B, and Service C) to the production environment. Each service registers its endpoint with the API Gateway, which in turn registers the API endpoints with the load balancer. The load balancer then routes traffic to the various services, and the production environment monitors the application's health and notifies the developer of any issues.
Conclusion
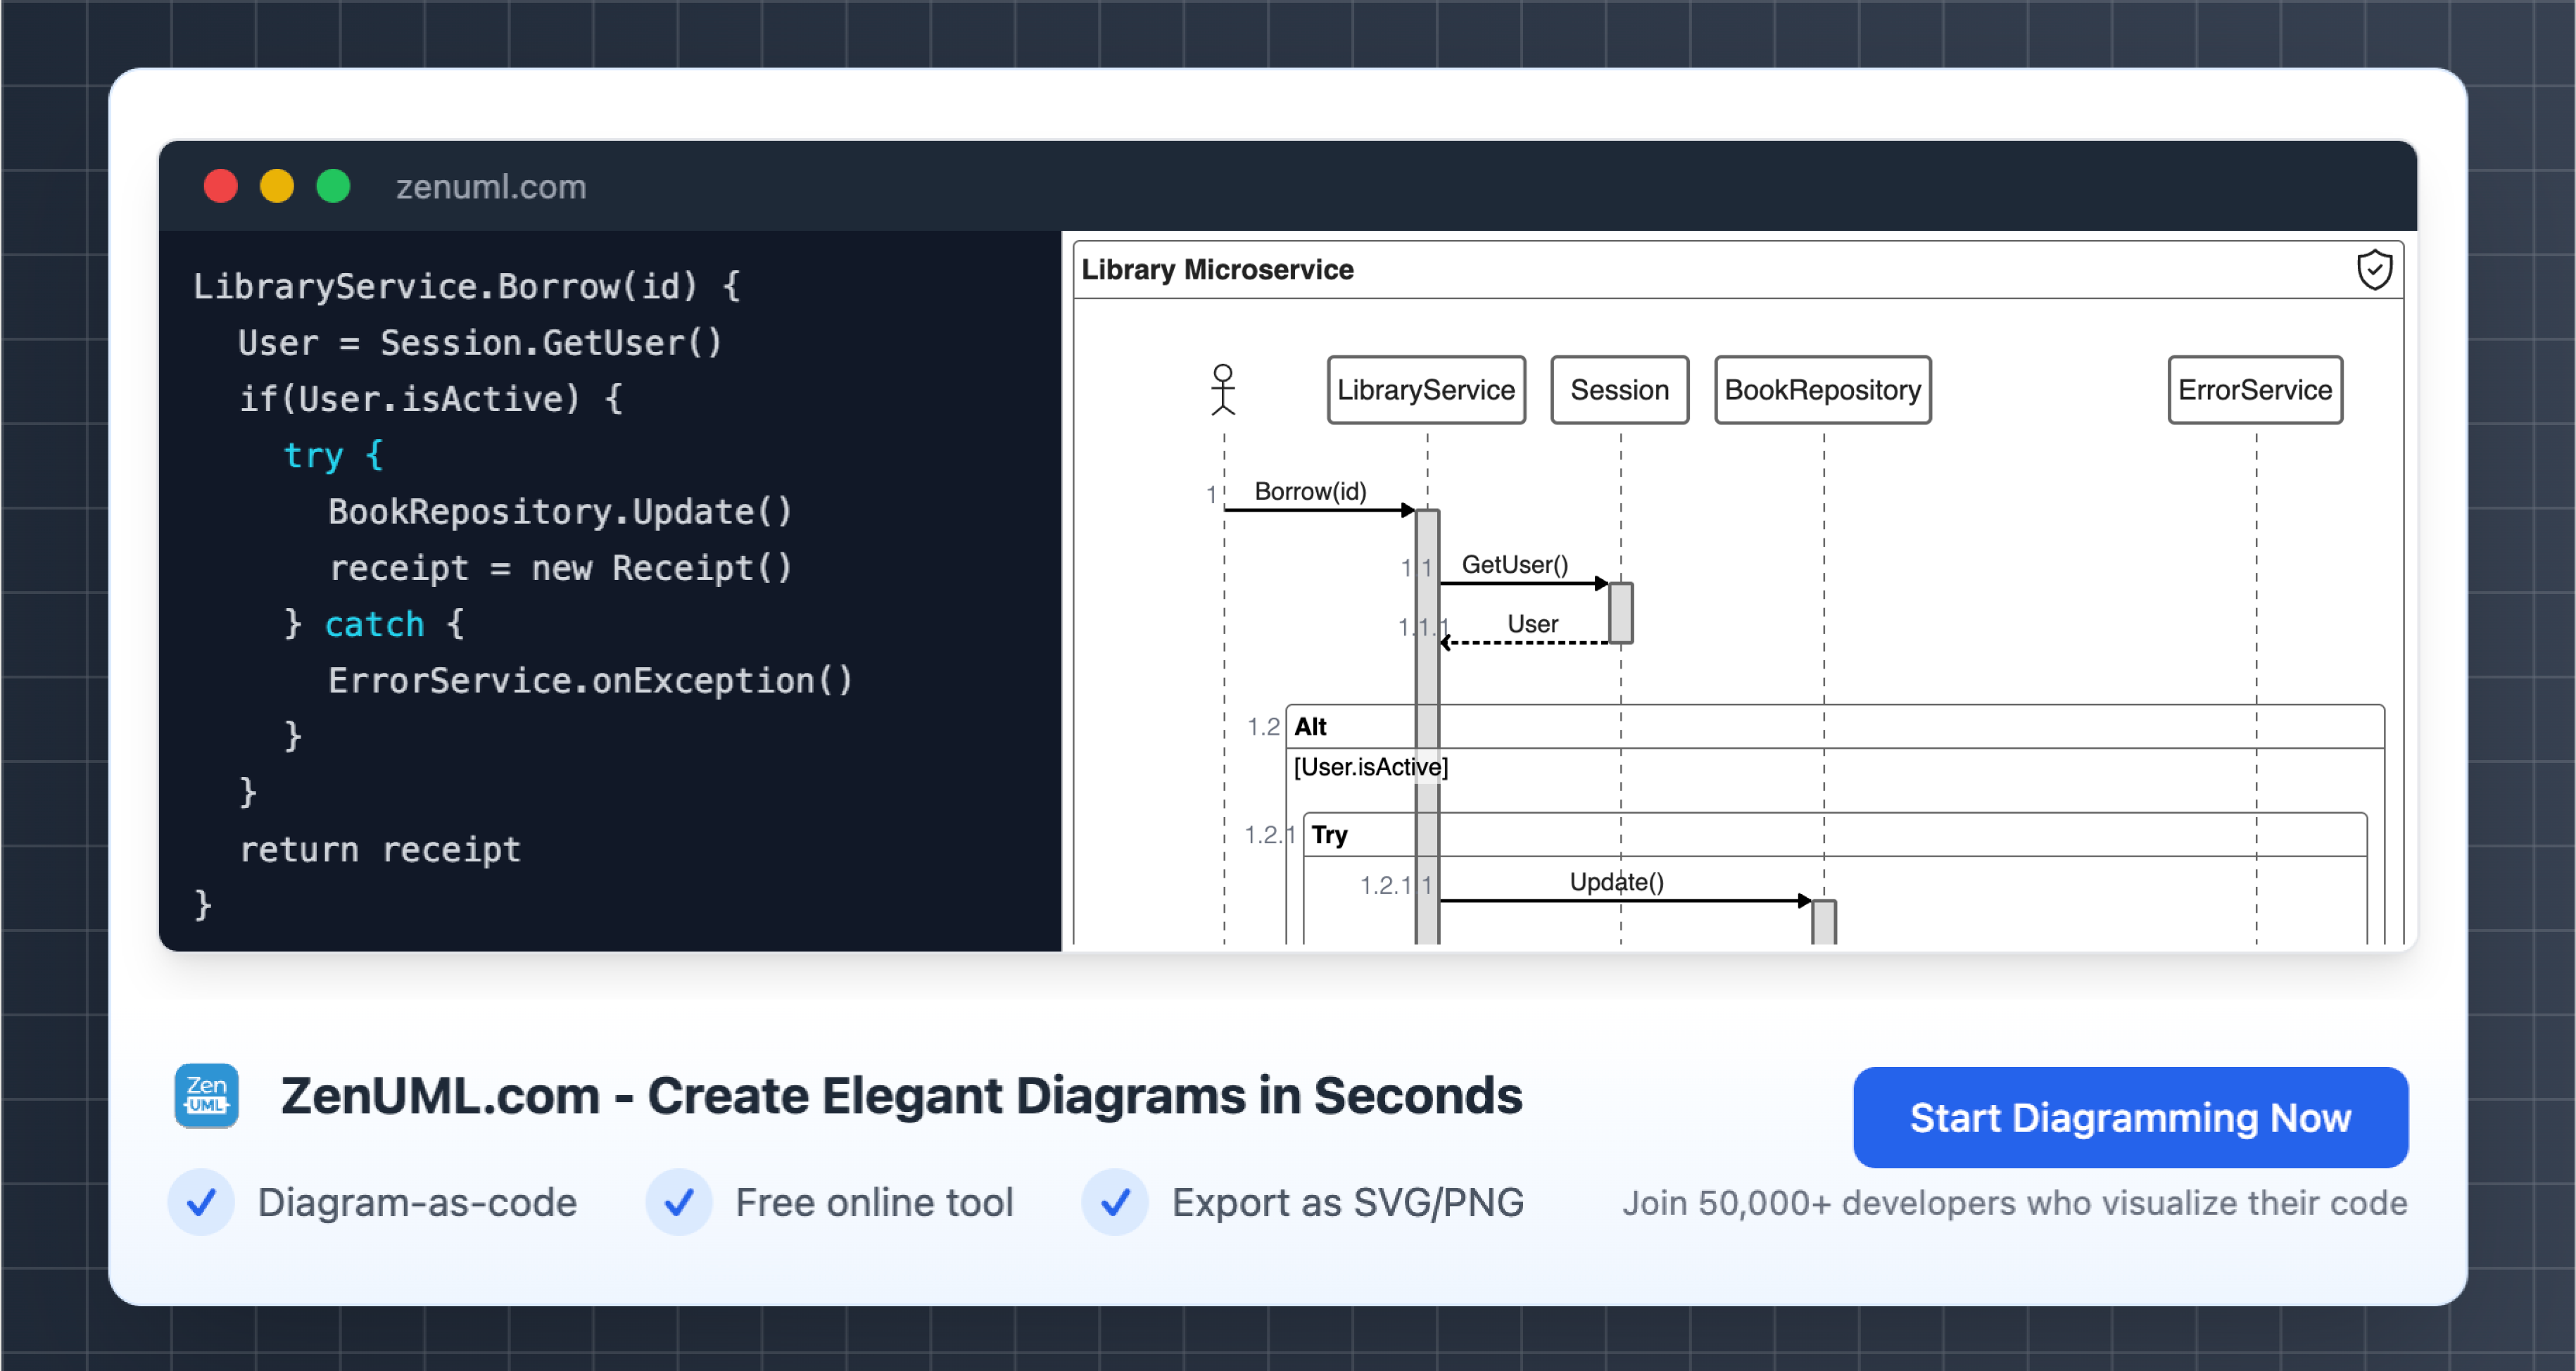
Sequence diagrams are a powerful tool in the DevOps toolbox, providing a clear and concise way to visualize and communicate the various processes and interactions involved in the development, deployment, and maintenance of software applications. By leveraging the capabilities of ZenUML, DevOps teams can easily create and share sequence diagrams that facilitate better collaboration, automation, troubleshooting, and knowledge sharing within their organizations.
As you continue to adopt and refine your DevOps
Try ZenUML now!
Zenuml detailed feature roadmap available here.