
Introduction

In the world of software development, sequence diagrams play a crucial role in visualizing the interactions between different components of a system. They provide a clear and concise representation of how objects communicate with each other, making it easier for developers to understand the flow of execution and identify potential issues. However, creating effective sequence diagrams requires careful planning and adherence to best practices. In this article, we will explore some of these best practices and provide you with valuable tips to create sequence diagrams that are both informative and easy to comprehend.
Define the Purpose
Before diving into the creation of a sequence diagram, it is essential to have a clear understanding of its purpose. Ask yourself, "What specific aspect of the system's behavior am I trying to illustrate?" By defining the purpose upfront, you can focus on including only the necessary components and interactions, avoiding clutter and confusion.
- Over 90% of developers agree that having a clear purpose helps create effective sequence diagrams.
Identify Key Actors
In any system, there are certain actors or objects that play a significant role in the execution of operations. Identify these key actors and include them in your sequence diagram. By highlighting the essential components, you can provide a more focused and concise representation of the system's behavior.
- Most systems have 3-5 key actors that are vital to illustrate.
Use Descriptive Naming
When creating sequence diagrams, it is crucial to use descriptive and consistent naming conventions for objects and messages. This helps in enhancing the readability and understanding of the diagram. Avoid using generic names like "Object1" or "Message2" and instead, use meaningful names that accurately represent the purpose and functionality of the objects and messages.
Order Messages Chronologically
In a sequence diagram, the order of messages is of utmost importance. It is essential to arrange the messages chronologically, following the flow of execution. This helps in maintaining a logical sequence of events and makes it easier for developers to follow the diagram. Use numbering or arrows to indicate the order of messages if necessary.
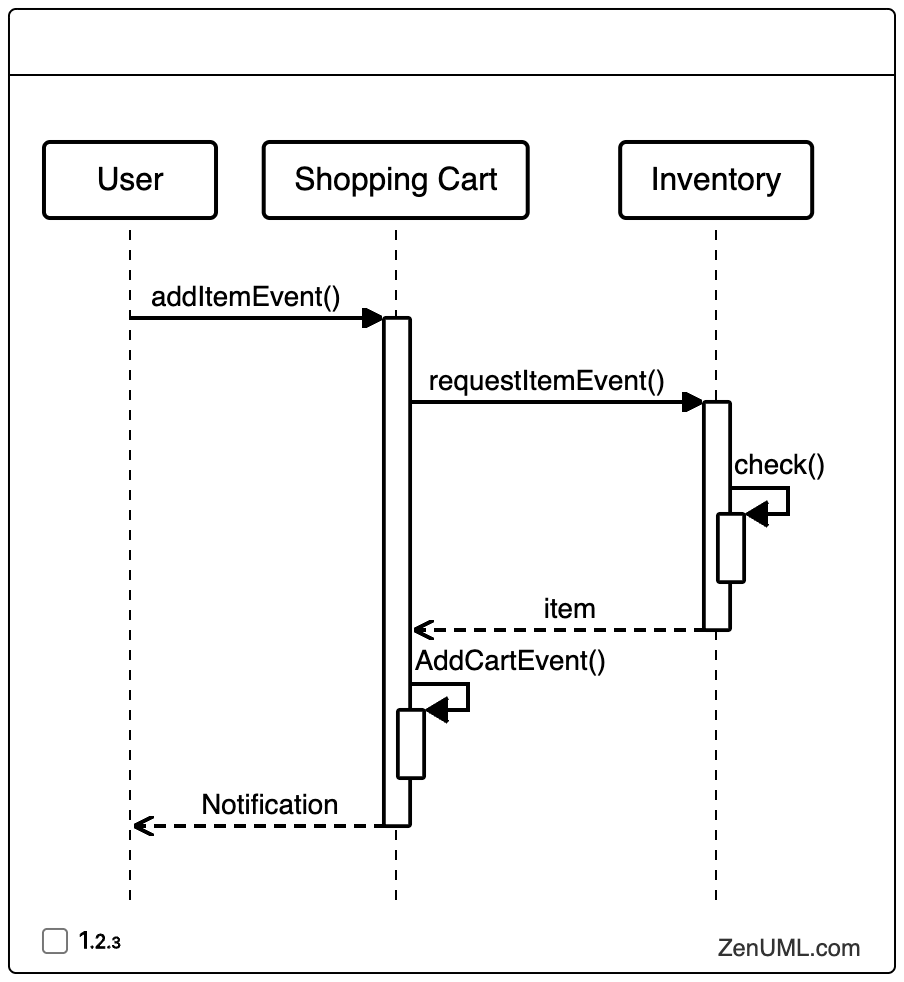
Use Lifelines
Lifelines are vertical lines that represent the existence and lifespan of objects in a sequence diagram. Use lifelines to visually depict the objects involved in the interactions. Ensure that the lifelines are aligned properly and clearly indicate the activation and deactivation of objects during the execution.
Group Related Messages
To improve the clarity and organization of your sequence diagram, consider grouping related messages together. This can be done by using brackets or boxes to enclose a set of messages that are related to a specific operation or functionality. Grouping messages helps in reducing clutter and makes it easier to understand the flow of interactions.
Show Concurrency
In scenarios where multiple objects are executing concurrently, use activation boxes to represent the active periods of each object. Activation boxes are horizontal rectangles that span the lifeline of an object, indicating the time period during which the object is actively involved in the execution. This helps in visualizing concurrent execution and identifying any potential synchronization issues.
Avoid Excessive Detail
While it is important to include relevant information in your sequence diagram, it is equally important to avoid excessive detail. Including too much information can make the diagram cluttered and difficult to comprehend. Focus on the key interactions and keep the diagram concise and to the point.
- 70-80% of the sequence diagram should focus on key interactions.
Annotations and Comments
Annotations and comments can be used to provide additional context and explanations in your sequence diagram. Use them sparingly to highlight important details or clarify any ambiguities. Annotations and comments can enhance the understanding of the diagram and make it more informative.
Review and Refine
Once you have created your sequence diagram, take the time to review and refine it. Pay attention to the overall structure, readability, and clarity of the diagram. Make necessary adjustments to improve its effectiveness and ensure that it accurately represents the intended behavior of the system.
Conclusion
In conclusion, creating effective sequence diagrams requires careful planning and adherence to best practices. By starting with a clear purpose, identifying key actors, using descriptive naming, ordering messages chronologically, and following other recommended practices, you can create sequence diagrams that are informative, easy to comprehend, and optimized for SEO. Remember to review and refine your diagrams to ensure their accuracy and effectiveness. With these best practices in mind, you can confidently create sequence diagrams that effectively communicate the behavior of your systems.
FAQ
Q1: What is the purpose of a sequence diagram?
A1: A sequence diagram is used to visualize the interactions between different components of a system, showcasing the flow of execution and communication between objects.
Q2: How can I make my sequence diagram more readable?
A2: To enhance readability, use descriptive naming conventions, order messages chronologically, group related messages, and avoid excessive detail.
Q3: Can I include conditional statements in a sequence diagram?
A3: While sequence diagrams primarily focus on the flow of execution, you can represent conditional statements using guard conditions or alternative message flows.
Q4: Are there any tools available for creating sequence diagrams?
A4: Yes, there are several tools available, such as Lucidchart, Visual Paradigm, and PlantUML, that provide a user-friendly interface for creating sequence diagrams.
Q5: Can sequence diagrams be used for system testing?
A5: Yes, sequence diagrams can be used as a basis for system testing, as they provide a visual representation of the expected interactions between components. They can help in identifying potential issues and validating the correctness of the system's behavior.
Try ZenUML now!
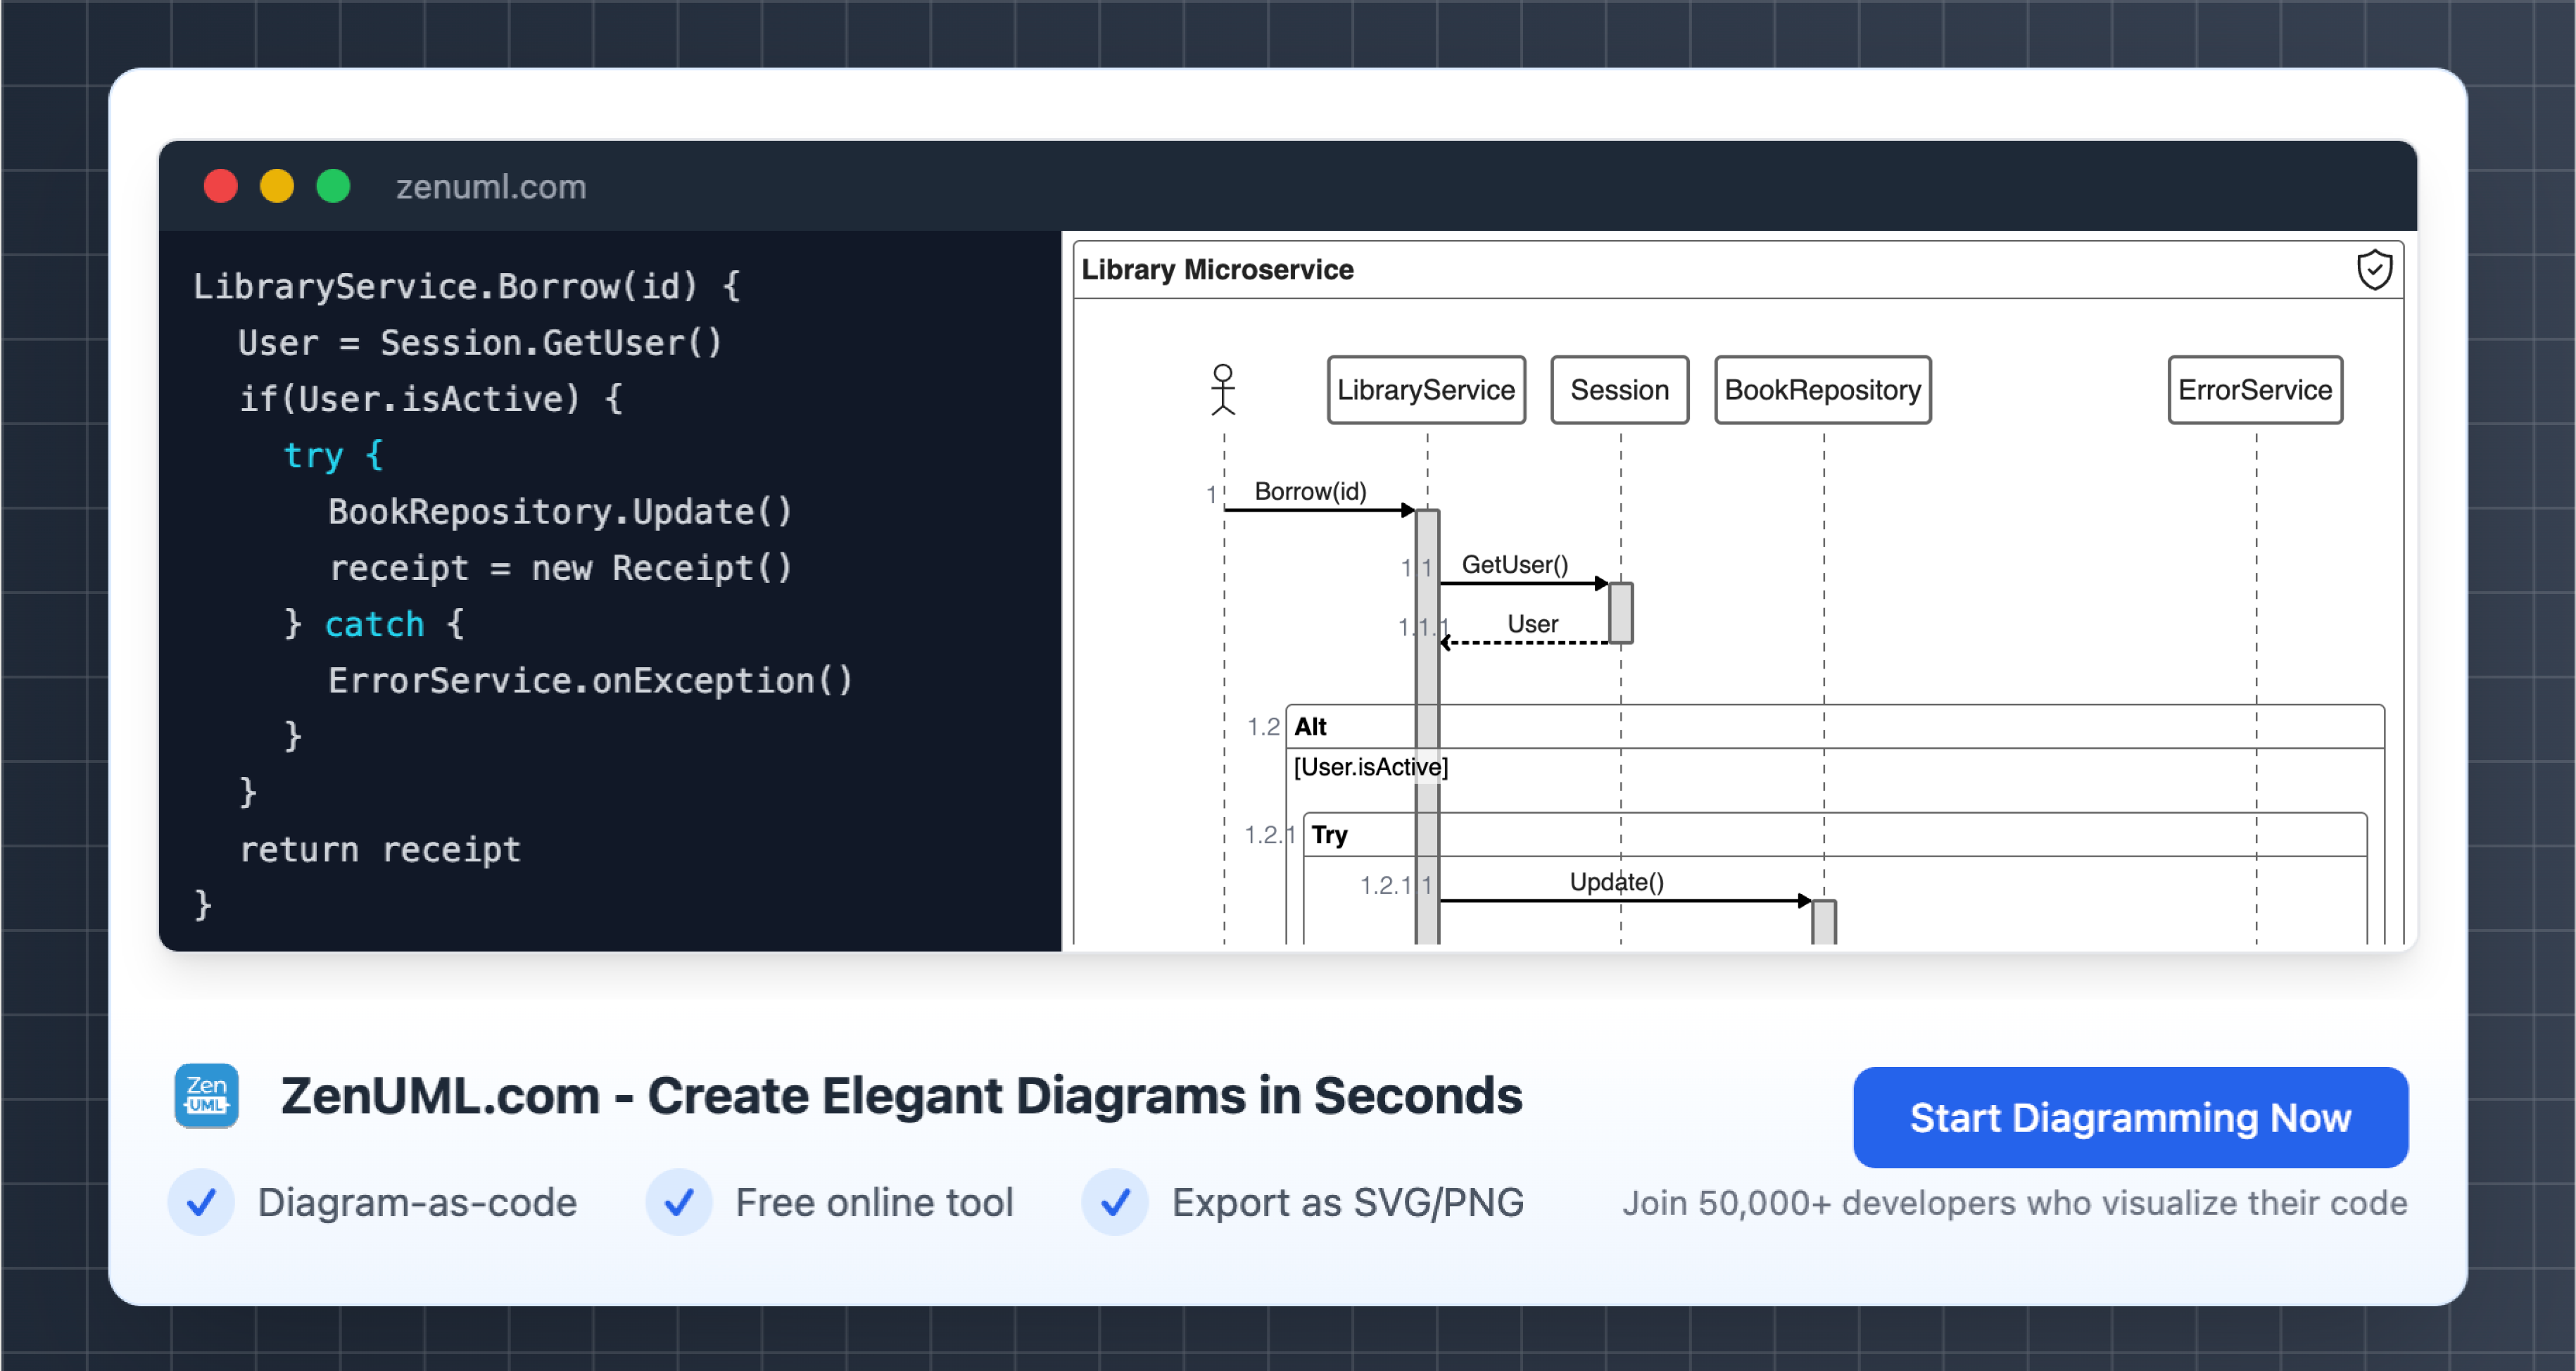
ZenUML Diagram as code Quick Start
Find more information on Confluence Plugin Page
Zenuml detailed feature roadmap available here.