Introduction to Sequence Diagrams in Business Analysis
Analyzing business workflows is an important step for any organization that wants to improve efficiency and maximize value. One useful tool for this type of analysis is a sequence diagram, which provides a visual representation of the steps involved in a specific process or workflow. In this article, I'll discuss how sequence diagrams can be used to break down workflows and identify areas for optimization.
The Value of Sequence Diagrams for Analysts
As a business analyst, I've found sequence diagrams to be extremely helpful for understanding how different systems, departments, and stakeholders interact throughout a workflow. A sequence diagram maps out the sequence of messages or events that occur between various entities over time, showing the order that each event takes place. This makes complex workflows and processes much easier to comprehend at a glance compared to trying to understand them just from written documentation or descriptions alone.
Key Entities in Sequence Diagrams
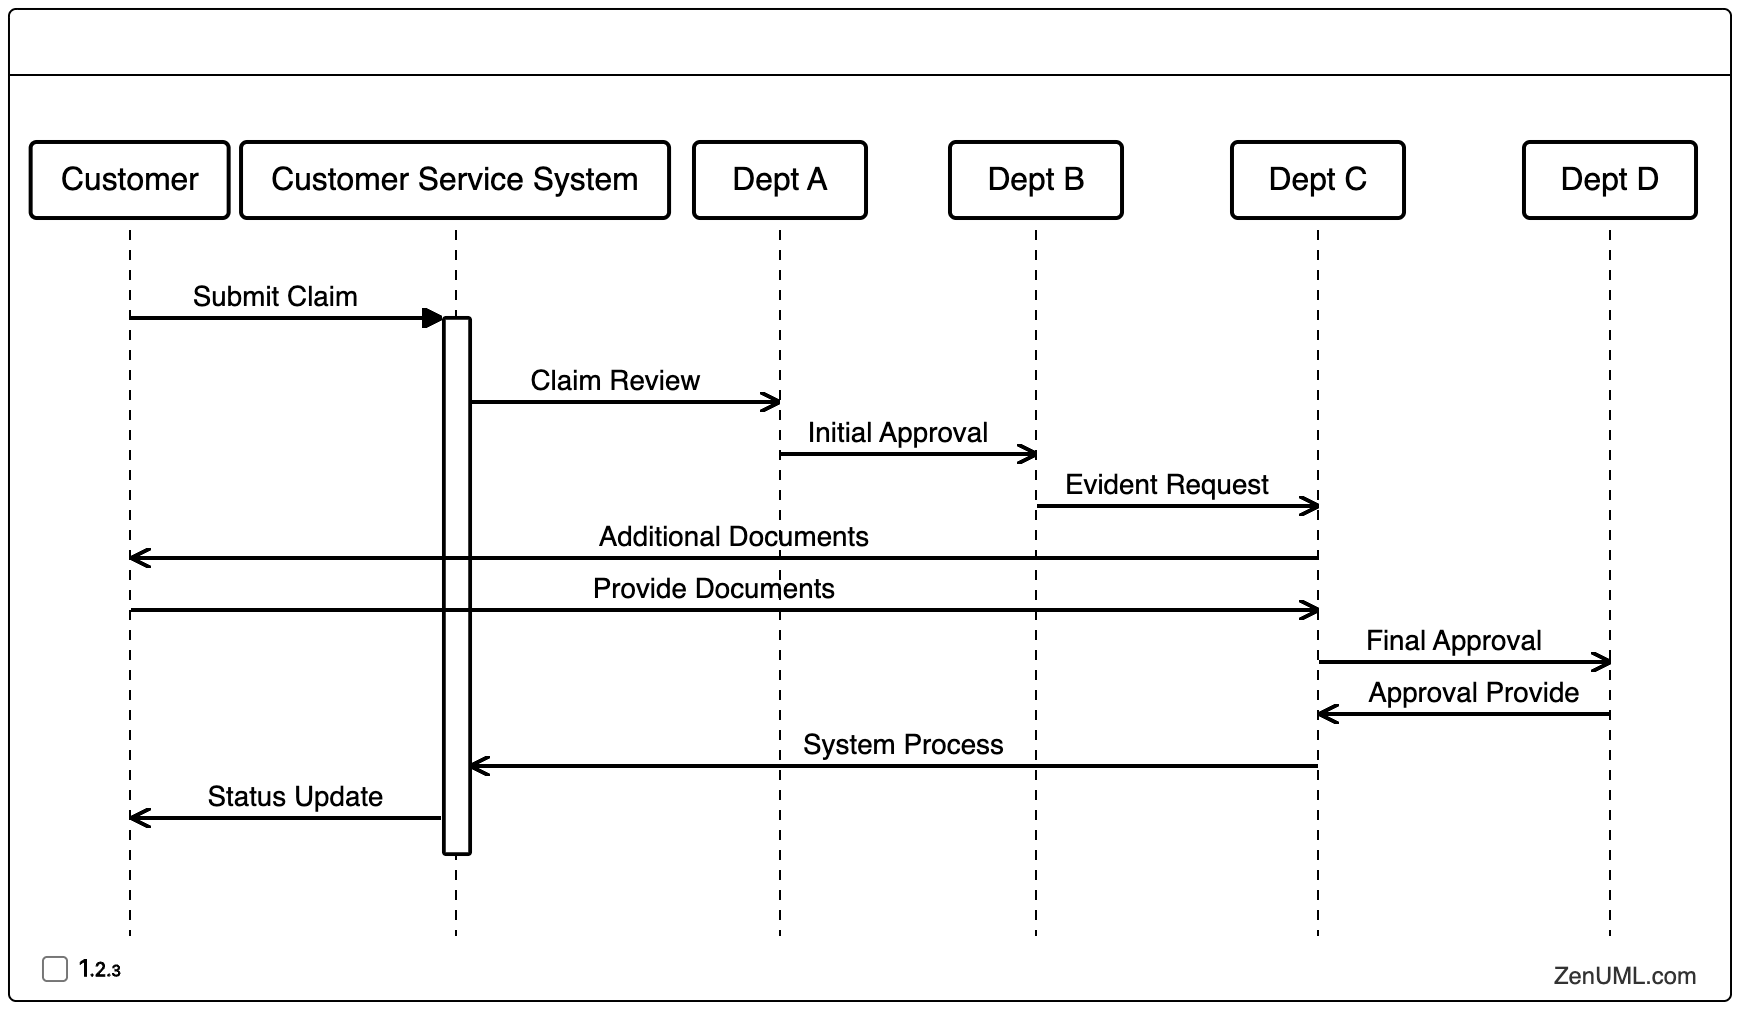
Some key entities that are often represented in a business workflow sequence diagram include internal departments or teams, external vendors or partners, customers or clients, and software systems or applications. Arrows are used to connect the entities and show the flow of messages or tasks from one to the next. Lifelines running vertically represent the different entities and provide a visual timeline for when each entity is actively involved in the process.
Creating Effective Sequence Diagrams
To create an effective sequence diagram, I like to start by mapping out the end-to-end workflow from beginning to end at a high level. This helps identify the major steps, responsibilities, and touchpoints. From there, each step can be broken down into more granular sub-steps and details added around conditions, decisions, branches, or loops that may occur. Additional entities involved in any given step are also noted.
Validating the Workflow Diagram
Once the basic diagram is created, it's a good idea to validate it by walking through the process with stakeholders from each area or department. This helps catch any missing or incorrect details before the analysis stage. With the diagram validated, you can then begin analyzing it to identify opportunities for optimization.
Identifying Opportunities for Optimization
Some common things to look for include unnecessary steps that could be removed, redundant approvals or handoffs, long wait times between steps, and areas where automation may help.
Areas where the workflow branches or has multiple potential paths based on conditions are also worth examining closely. These types of decision points or non-linear flows tend to introduce more complexity, risk of errors, and potential bottlenecks. The sequence diagram makes it very clear where these occur so the business logic and rules governing each path can be evaluated for opportunities to simplify decision-making or consolidate similar paths.
Case Study: Insurance Provider
As an example, one of my clients was a large insurance provider whose claims processing workflow involved numerous manual handoffs between different departments and systems. By mapping this out in a sequence diagram, we could see there were over 15 separate approval steps throughout the process, each one introducing delays. We worked with their teams to identify which approvals were truly necessary versus those adding minimal value. This allowed them to streamline the workflow significantly by removing unnecessary approvals and automating status updates between systems.

Sequence Diagrams for Documentation and Training
In addition to process optimization, sequence diagrams are also useful for documentation purposes. Having a clear visual representation of workflows makes it much easier for new hires, replacements, or outside teams to understand how everything connects without needing extensive training. It can also help identify any knowledge gaps where institutional knowledge is not being properly captured and documented. And of course, sequence diagrams play an important role in any redesign project, allowing teams to map out proposed changes clearly before implementation.
Conclusion: The Advantages of Sequence Diagram Analysis
In summary, taking the time to analyze business workflows using sequence diagrams can yield significant benefits for process efficiency, risk reduction, knowledge transfer, and continuous improvement initiatives. Any organization seeking to streamline operations and maximize value should consider incorporating this visualization technique into their process analysis and documentation toolkit. The clear picture it provides of how people, systems and information flow throughout a workflow is invaluable for gaining insights to optimize end-to-end processes and customer experiences.
Try ZenUML now!
ZenUML Diagram as code Quick Start
Find more information on Confluence Plugin Page
Zenuml detailed feature roadmap available here.

